


The municipal bond market is well positioned heading into 2025. We maintain an optimistic outlook as all-in yields in the tax-exempt market present a compelling alternative to equities, and municipal credit remains strong going into the new year.
It is important to recognize that going forward, after two years of spectacular performance in the equity market, prudent investors should be re-evaluating their allocations to equities and fixed income. Because of the current yield capture opportunities, the risk/reward ratio has shifted in favor of fixed income. For an investor in the 40% tax bracket, the after-tax yield on an A-rated municipal bond in the 10-year range is roughly 6%!
The biggest question that many investors have with respect to the municipal bond market is whether the municipal bond tax exemption is likely to be repealed. The easy answer is that there is substantial support for the tax exemption in Congress and repealing the exemption would not raise significant dollars for the federal government. The Treasury Department has indicated that if all municipal bonds were considered taxable, an additional $281 billion would be raised in the next decade. Given that the cost of extending the entire 2017 Tax Cuts and Jobs Act (“TCJA”) is roughly $5 trillion over the next decade this is not a significant amount of money to fund the extension.
However, it is noteworthy that an early draft of the TCJA had proposed eliminating the ability of some issuers, like airports, private universities, and hospitals to issue tax-exempt bonds. There is some chance this notion could be resurrected.
Most market prognosticators believe, as One Oak does, that rate volatility will continue in 2025. Generally, this means that a buy and hold approach to the municipal bond market will not be advantageous. An active management strategy that takes advantage of opportunities in the municipal marketplace will be optimal for the new year.
2024 saw a resilient U.S. economy that far outpaced most other economies, despite substantial interest rate volatility in the fixed income markets tied to concerns about inflation and the size of the federal government’s debt.
Notwithstanding significant GDP growth in the first three quarters, there was a clear distinction between the haves and the have nots. Economic gains were driven by household spending by those with $100,000+ a year income. Those below were squeezed by higher prices for groceries and other necessities. One of the key drags on the U.S. economy has been the sputtering U.S. housing market. Overall purchases of previously owned homes in 2024 are expected to hit the lowest level since 1995. Turnover in the housing market leads to significant expenditures to fix up and furnish new homes. In addition, executives from Home Depot and Lowe’ssay rising prices caused their customers to delay home projects and other discretionary purchases in 2024.
Nevertheless, the U.S. economy ended 2024 on a high note. Real gross domestic product is on pace to expand by 2.7% this year, bolstered by consumer spending and productivity growth. Recently, third-quarter real GDP growth was revised upward to an annualized 3.1% pace from the preliminary estimate of 2.8%, mainly due to stronger personal spending. The Atlanta Fed’s GDP fourth-quarter estimate is 2.6% as of January 2, 2025.
The municipal market reached $4.2 trillion in the third quarter of 2024 with ownership continuing to shift away from entities subject to the corporate tax rate toward households and products subject to individual tax rates. Total municipal new issuance finished the year at roughly $490 billion, which was up approximately 40% compared to 2023. The investment grade market saw elevated supply consistently throughout the year. Investment grade indices were at extremely rich levels coming into 2024. As Treasuries sold off during the year, investment grade returns suffered.
Generally, supply in the high-yield municipals market was subdued for the first three quarters of 2024 but rebounded in the fourth quarter. Attractive rates drove consistent inflows into high-yield municipal funds during 2024. As a result, HY spreads tightened substantially, and are trading near the all-time lows.
During the first quarter of 2024, the municipal bond market became a seller’s market. Many primary deals were heavily oversubscribed with issuers having significant influence over couponing and structure. Through the end of March, year-to-date municipal issuance increased 20% year-over-year. The longest maturity and largest bonds saw substantial demand after modest concessions of 5-10 basis points, with several over-subscribed 5-7 times. Muni credit continues to be in good shape due to strong rainy-day funds and preemptive moves by municipalities to mitigate budget shortfalls.
Credit fundamentals remained strong, with upgrades outpacing downgrades.
In April, it became apparent that progress on inflation was stalling with the fixed income markets experiencing significant turbulence following the April 10th Consumer Price Index report. This was evidenced by the tepid demand observed in a Treasuries auction involving $39 billion worth of 10-year Treasurys, as well as 3-year and 30-year Treasuries. During the month, yields for the 1-year, 5-year, 10-year, 20-year and 30-year Treasuries experienced increases of 22 to 51 bps. The high-grade municipal benchmark rose by 28-29 bps across 5, 10 and 30-years. At month-end all points on the municipal AAA high-grade curve were near their YTD highs. Generally, stocks and bonds rallied in May and June, gaining momentum after jobs data indicated cooling in the labor market. Record tax-exempt new issuance was reached as municipal investors came off the sidelines and the fear of missing out (“FOMO”) was prevalent.
In July, municipal market new issues performed well but buyers were frustrated that they could not obtain the allocations that they desired. The market experienced turbulence due to a weaker-than-expected jobs report, but it recovered during the balance of the quarter. Thus, investment-grade municipal relative valuations became more attractive with yields at historical highs.
In October, the expected volatility prior to the election caused a significant increase in rates, some spread widening and yield curve steepening which drove down municipal benchmarks by 1.5%. During the month inflows into municipal mutual funds were $26B for investment grade funds and $11B for high yield funds. The month saw a new record for tax-exempt issuance of $56B. In November, Trump’s win ignited a rally in the financial markets for the balance of the month as investors believed his proposed tax cuts and focus on deregulation would bolster corporate profits. His win coupled with the Consumer Price Index ticking up to a 2.7% increase drove interest rates higher based on the perception that Trump’s policies would cause an increase in the budget deficit and increased inflation.
During the final month of the year, the tax-exempt new issue supply roared back in the first few weeks of the month. Muni debt issuance exceeded $33B, a 27% increase year-over-year. Wall Street was surprised by the Fed’s “hawkish cut” which rolled back expectations about future rate cuts. Markets lost their momentum after the Fed signaled doubt over how much more it will cut rates. AAA municipal yields were up 29 bps to 35 bps on the month while UST yields were up 33 bps to 42 bps.
Coming into January 2024 the taxable municipal market continued to offer attractive yields and spreads relative to corporates. However, taxable municipal spreads to corporates narrowed considerably through the first four months of 2024. Taxable spreads versus 20-year Treasuries were tighter than those seen in October 2023, and spreads in the non-Build-America Bonds (“BAB”) portion of the taxable municipal market have continued to rally. This spread tightening was driven by several factors including inflows into municipal open-end funds, demand for diversification among dollar-denominated assets, and a continuing appetite for high-quality, long-duration assets. Additionally, this year's net taxable municipal supply reduction of $19 billion provides a favorable technical backdrop. In 2024 there were more than $15bn in BABs called through their ERP calls. In 2025 more ERP calls are likely, especially if MMD-UST ratios decline, making refundings more attractive.
Taxable municipal bonds have outperformed most broader taxable fixed income products, except for BBB and high-yield corporate bonds. However, Citigroup’s departure from the municipal bond market was not good news as its departure reduced liquidity in the taxable municipal market.
Enticing all in yields coupled with sound fundamentals and buoyant fund flows kept the US corporate bond market heavily supported in 2024. The corporate bond market began the year in an environment dictated by demand, and as issuers looked to capitalize on lower borrowing costs, the new issue market boomed. This resulted in the busiest first quarter on record for syndicate. As the year drew on, US investment-grade corporate bond spreads continued to narrow. Despite the array of economic, political, and geopolitical uncertainties, the assert class remained supported by investors looking for duration amid expectations of lower rates. IG cash spreads ended 2024 just a tad away from 25-year tight levels at +80 while the Bloomberg US Aggregate Corporate YTW closed at 5.32%.
A significant number of companies took advantage of the favorable financing conditions in 2024 to issue debt. Investment-grade companies issued $1.662 trillion in debt this year through early December 2024, up 27% from the same period a year earlier and the most since 2020, according to Dealogic. There were many reasons for these financings, ranging from adding cash to the balance sheet to pay for future refinancing needs, to finance transactions and a wide variety of other projects. The principal cause of the favorable financing conditions was that credit spreads were tight throughout the year.
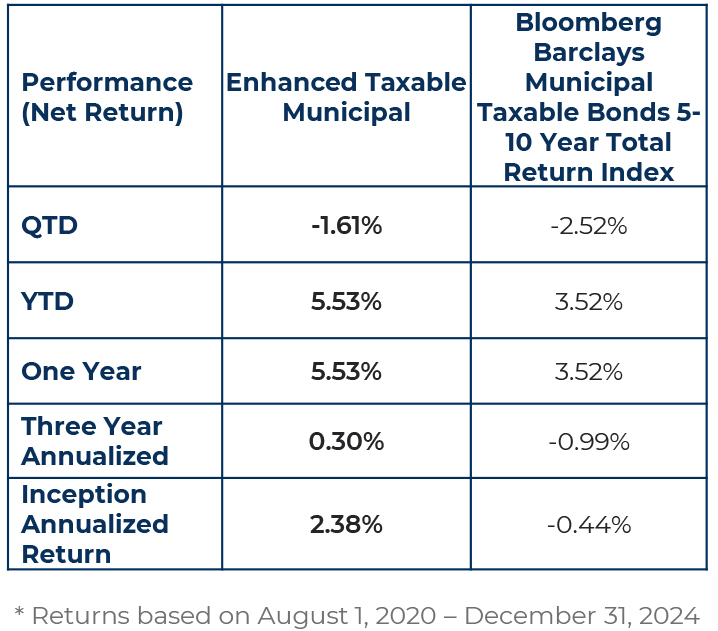
The One Oak Enhanced Municipal Strategy, and the One Oak Enhanced Taxable Municipal Strategy both had solid performance in 2024, despite a serious pullback in treasuries. Our outperformance verses comparable indices was due to active management and diversification of sectors and structures.
The One Oak team sincerely appreciates our investors. We are very excited about 2025!
One Oak Capital Management is an SEC-registered investment adviser and manager of separately managed portfolios. Registration as an investment adviser does not imply a level of skill or training. This presentation is not an offer to sell, or the solicitation of an offer to purchase, any investment managed or sponsored by One Oak Capital Management or any of its affiliated entities (collectively, “One Oak”). The index shown is provided for illustrative purposes only, is unmanaged, reflects the reinvestment of income and dividends, and does not reflect the impact of advisory fees. Investors cannot invest directly in an index. Comparisons to indices have limitations because indices have volatility and other material characteristics that may differ from a particular OneOak strategy. One Oak's performance may differ substantially from the performance of an index. In addition, data used in the benchmark are obtained from sources considered to be reliable, but One Oak makes no representations or guarantees with regard to the accuracy of such data. The EnhancedMunicipal Portfolio uses active management and is not benchmarked to the index.
Past performance is not representative of future return performance. Net returns are calculated by deducting the highest standard fee from the gross returns on a quarterly basis. The returns reflect the net performance of employing One Oak's highest fee, 0.30% per year to the gross performance. Net returns do not include any additional intermediary fees that may be charged to the end investor. The presentation and the net performance is meant for financial professionals use only and is not intended for distribution to the end users. The returns include the reinvestment of dividends, interest, and other earnings. The information provided was calculated by One Oak Capital Management, LLC using a combination of proprietary and external data sources and has not been audited for accuracy. While interest on municipal bonds is generally exempt from federal income tax, it may be subject to the federal alternative minimum tax, or state or local taxes. Profits and losses on federally tax-exempt bonds may be subject to capital gains tax treatment. Fixed income risks include, but are not limited to, changes in interest rates, liquidity, credit quality, volatility, and duration. One Oak's management fees are deducted each quarter on the first month of the quarter: January, April, July and October. One Oak does not accrue its management fee for the remaining months and therefore the net performances for those months will be higher and does not represent the actual annual net returns.
Due to various risks and uncertainties, actual events, results or the actual performance of the investment may differ materially from those reflected or contemplated in the returns presented within. While assumptions underlying various statements as to the future performance are believed to be reasonable in nature, prospective investors should make their own assessments as to such assumptions and the associated risks, including the likelihood of the strategy achieving the corresponding results. All of which are subject to risks and uncertainties many of which are beyond the control of the investment adviser. As such, no assurance is given as to the realization of any such future performance. No representation or warranty is made as to the future performance or such forward-looking statements. The delivery of this presentation does not imply that any other information contained herein is correct as of any time subsequent to the presentation date. Actual performance results may differ from composite returns, depending on the size of the account, investment guidelines and /or restrictions, inception date, and other factors. One Oak Capital Management, LLC ("One Oak") claims compliance. with the Global Investment Performance Standards (GIPS) and has prepared and presented this report in compliance with the GIPS standards. One Oak has been independently verified for the periods 2019 through 2022.
These materials contained confidential and proprietary information and have been provided with the express understanding that their distribution or the divulgence of any of their contents to any person, other than the person(s) to whom they were originally delivered and such person’s advisors, without the prior consent of One Oak is prohibited.
To invest with One Oak Capital Management LLC, you must be a qualified or accredited investor. Different share classes may have different results. Consult your individual statement.
For more information regarding the Morningstar Rating methodology please visit www.morningstar.com/content/dam/marketing/shared/research/methodology/771945_Morningstar_Rating_for_Funds_Methodology.pdf
The PSN Municipal Universe consists of 213 strategies, across 98 firms. PSN utilizes a proprietary of our clients’ top priority performance screens. PSN Top Guns runs products in six proprietary categories in over 50 universes. This is a highly anticipated ranking and is widely used by institutional asset managers
References made to awards/rankings are not an endorsement by any third party to invest with One Oak and are not indicative of future performance. Investors should not rely on awards/rankings for any purpose and should conduct their own review prior to investing
One Oak Capital Management has done several tax-harvesting trades for the Enhanced and Enhanced Taxable Municipal Portfolio
Logos are protected trademarks of their respective owners and One Oak disclaims any association with them and any rights associated with such trademarks.
