



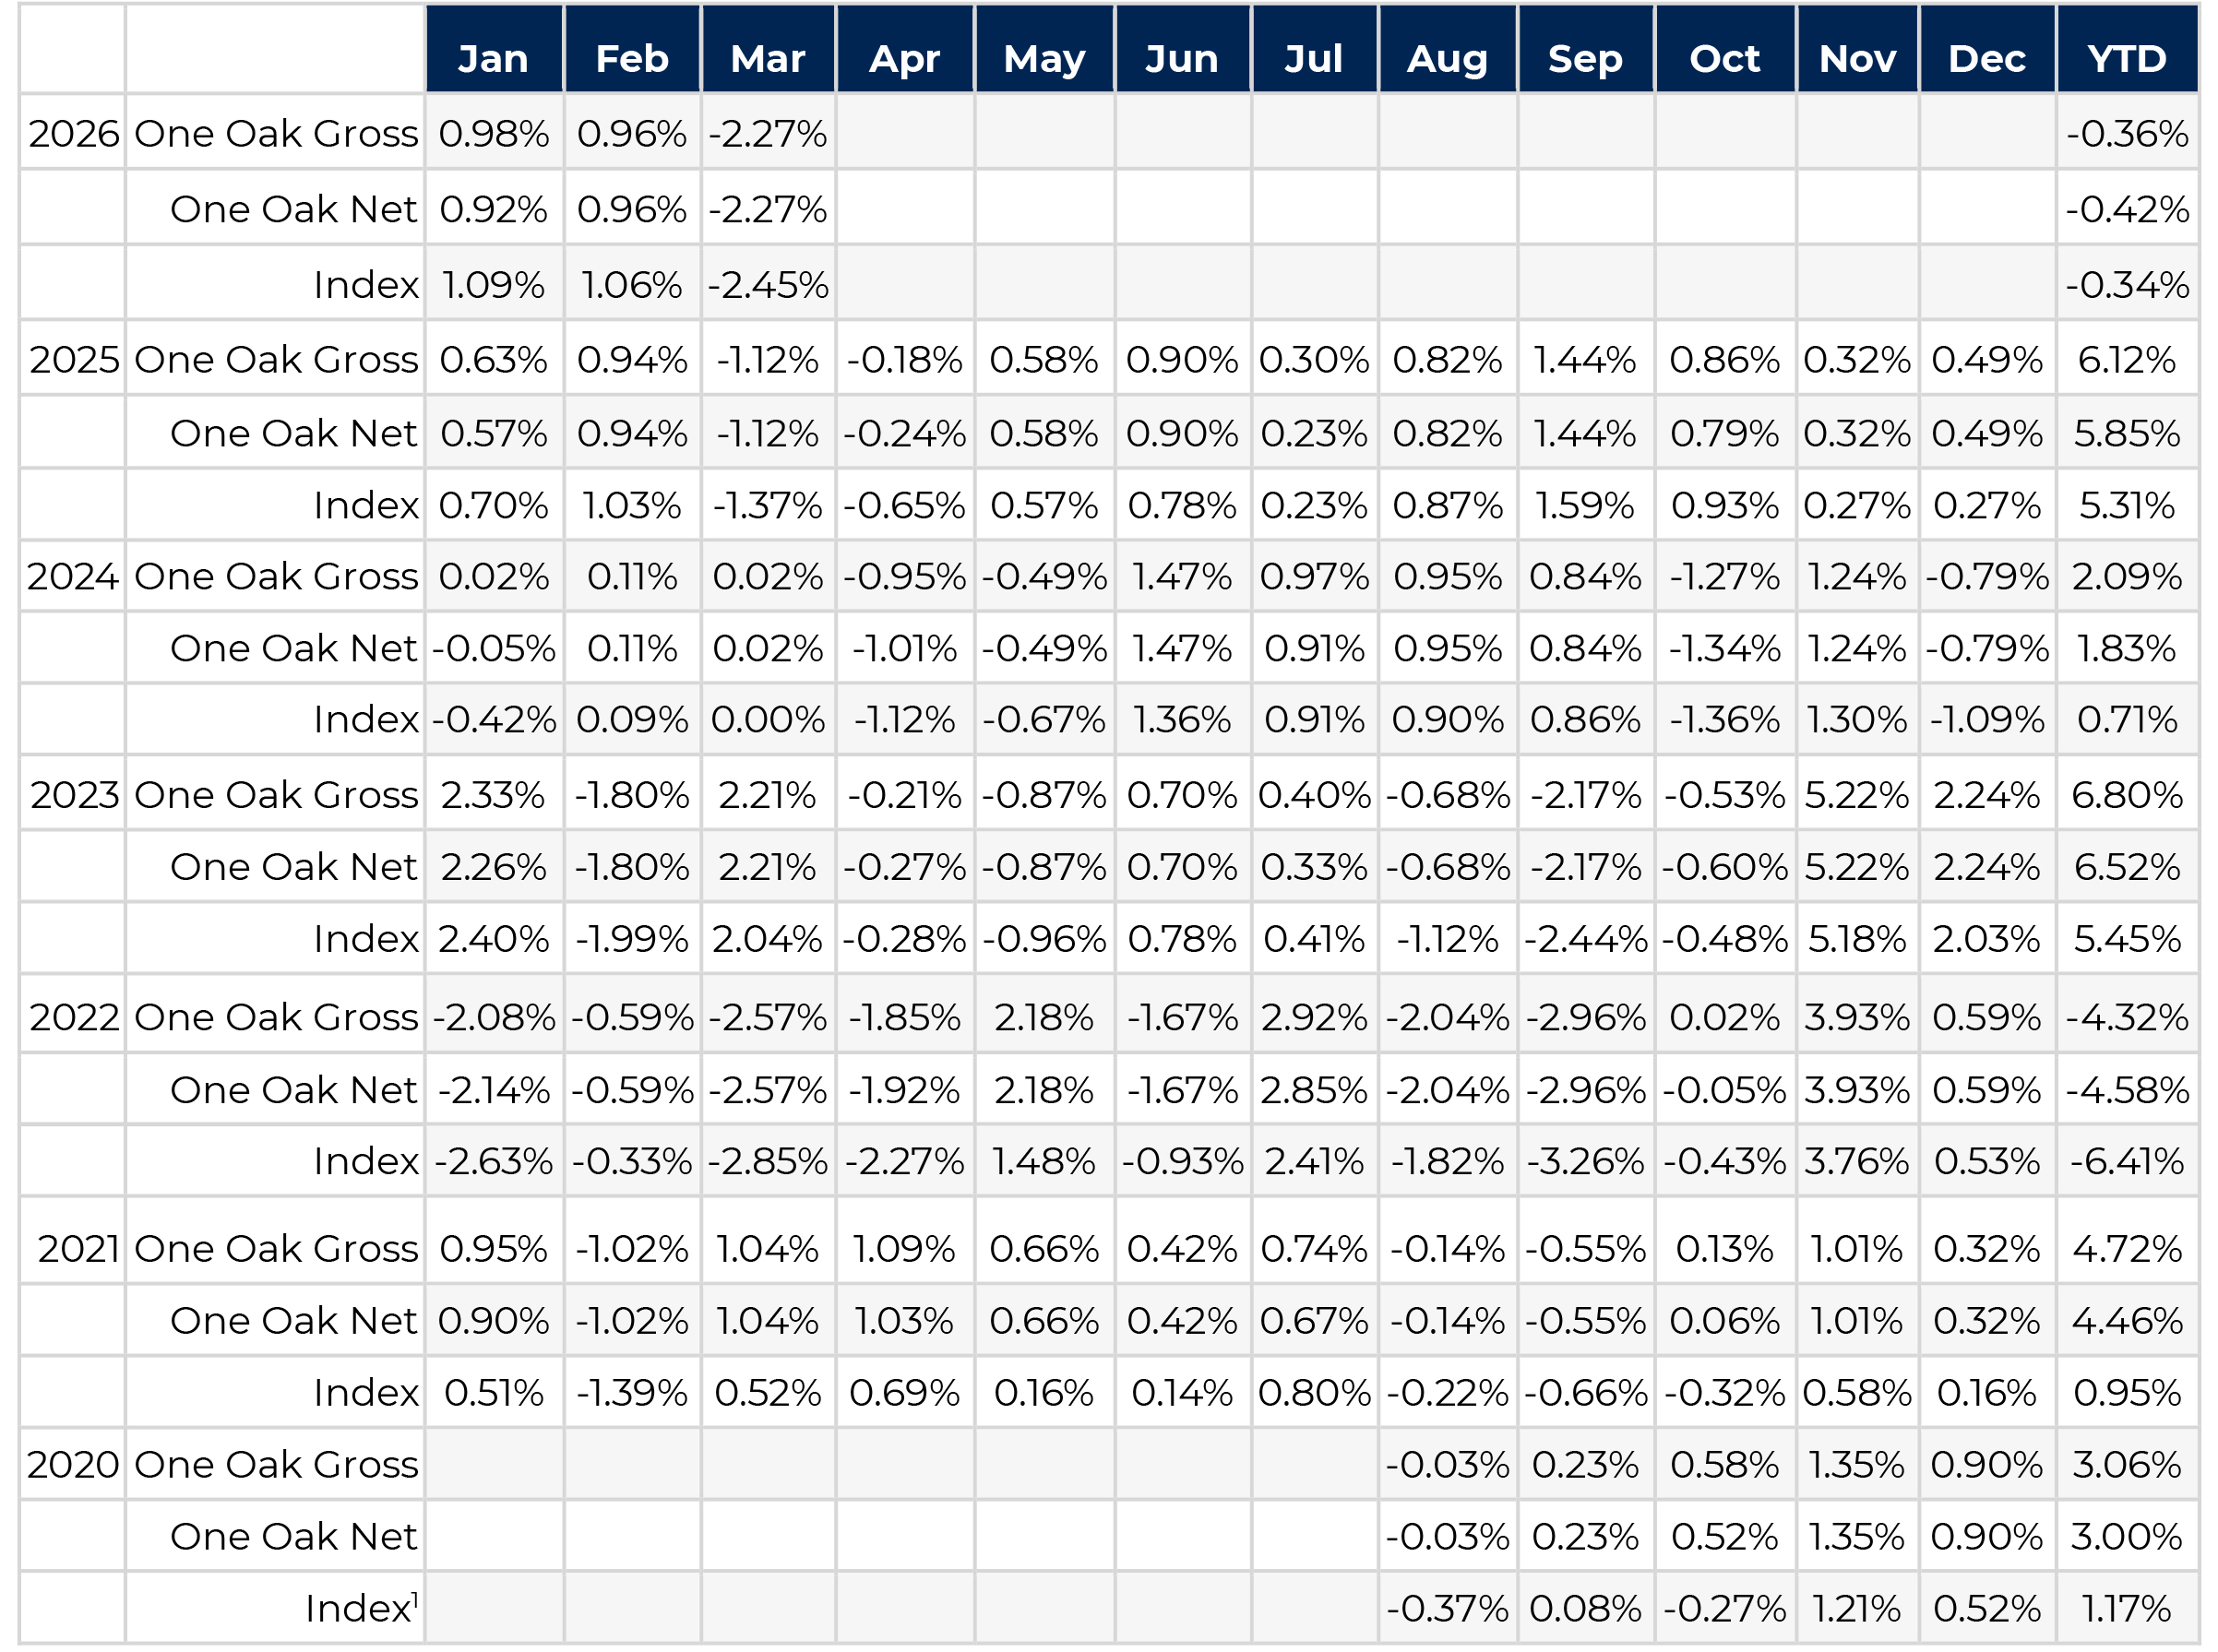
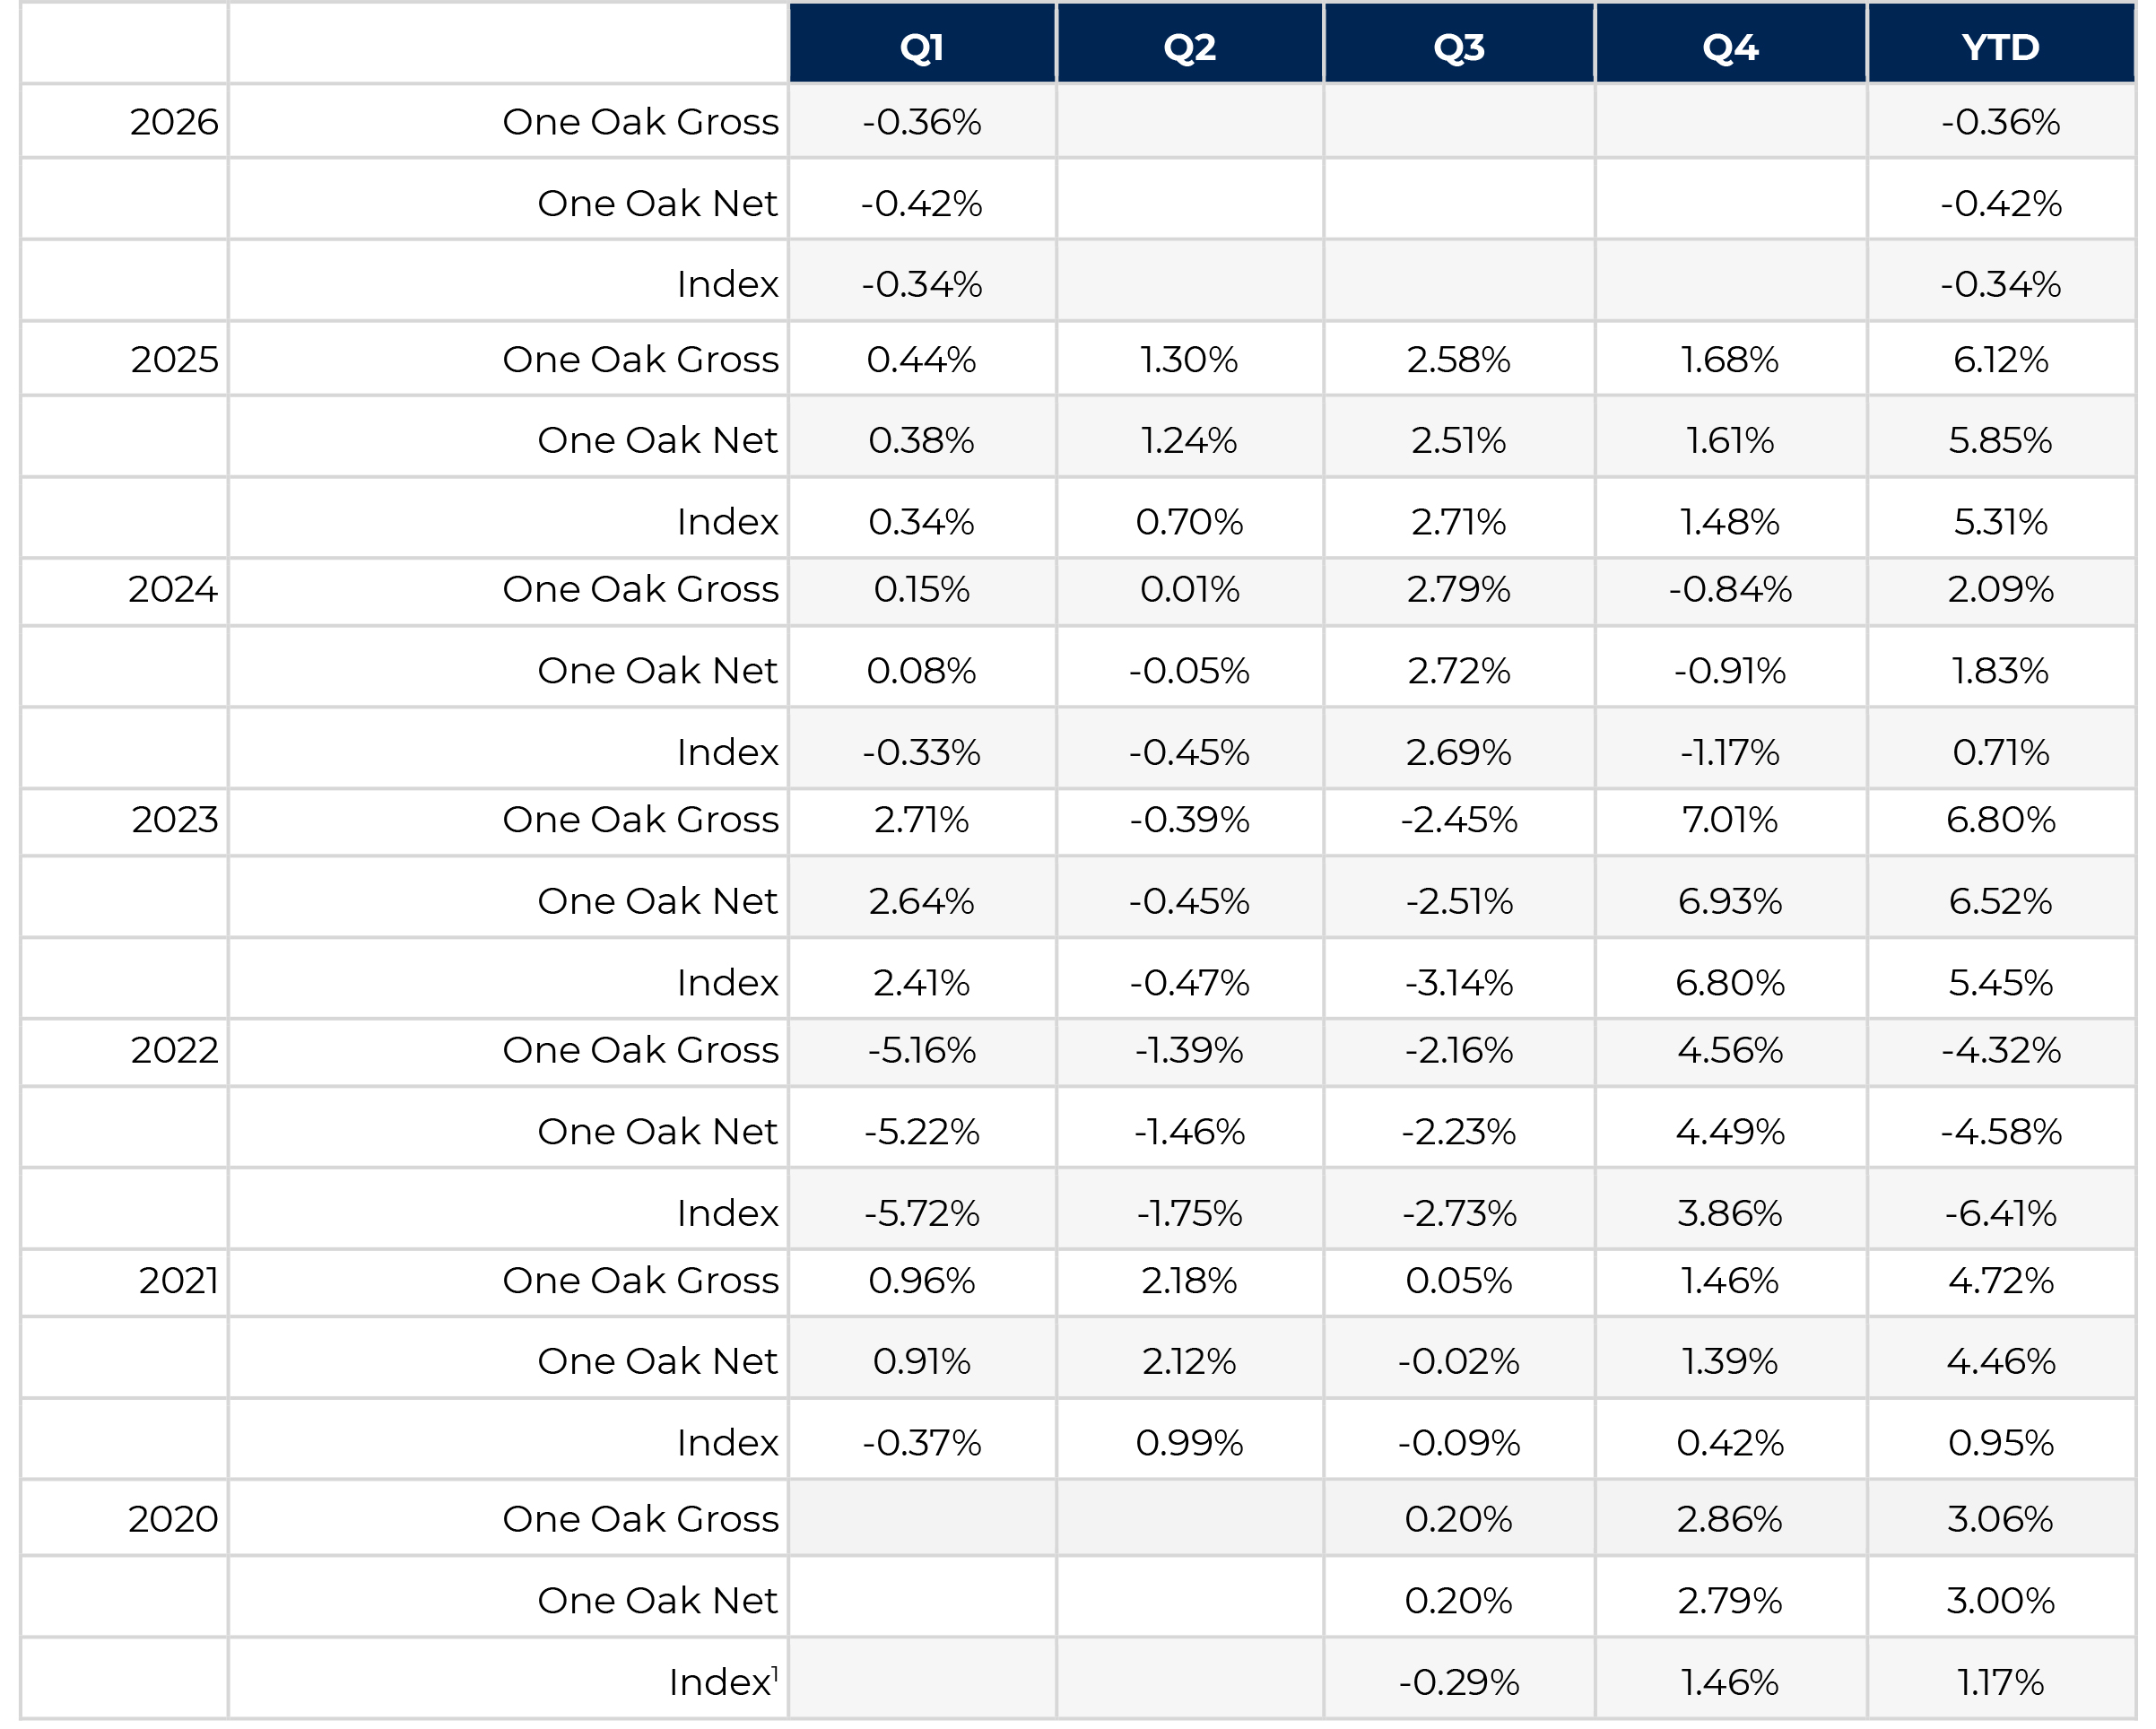
1 Inception date is August 1, 2020. Inception date gross and net returns are annualized.
2 Source: Bloomberg
Past performance is no guarantee of future results.
1 Source: Bloomberg 3-15 Year Blend (2-17) Index
Past performance is no guarantee of future results.
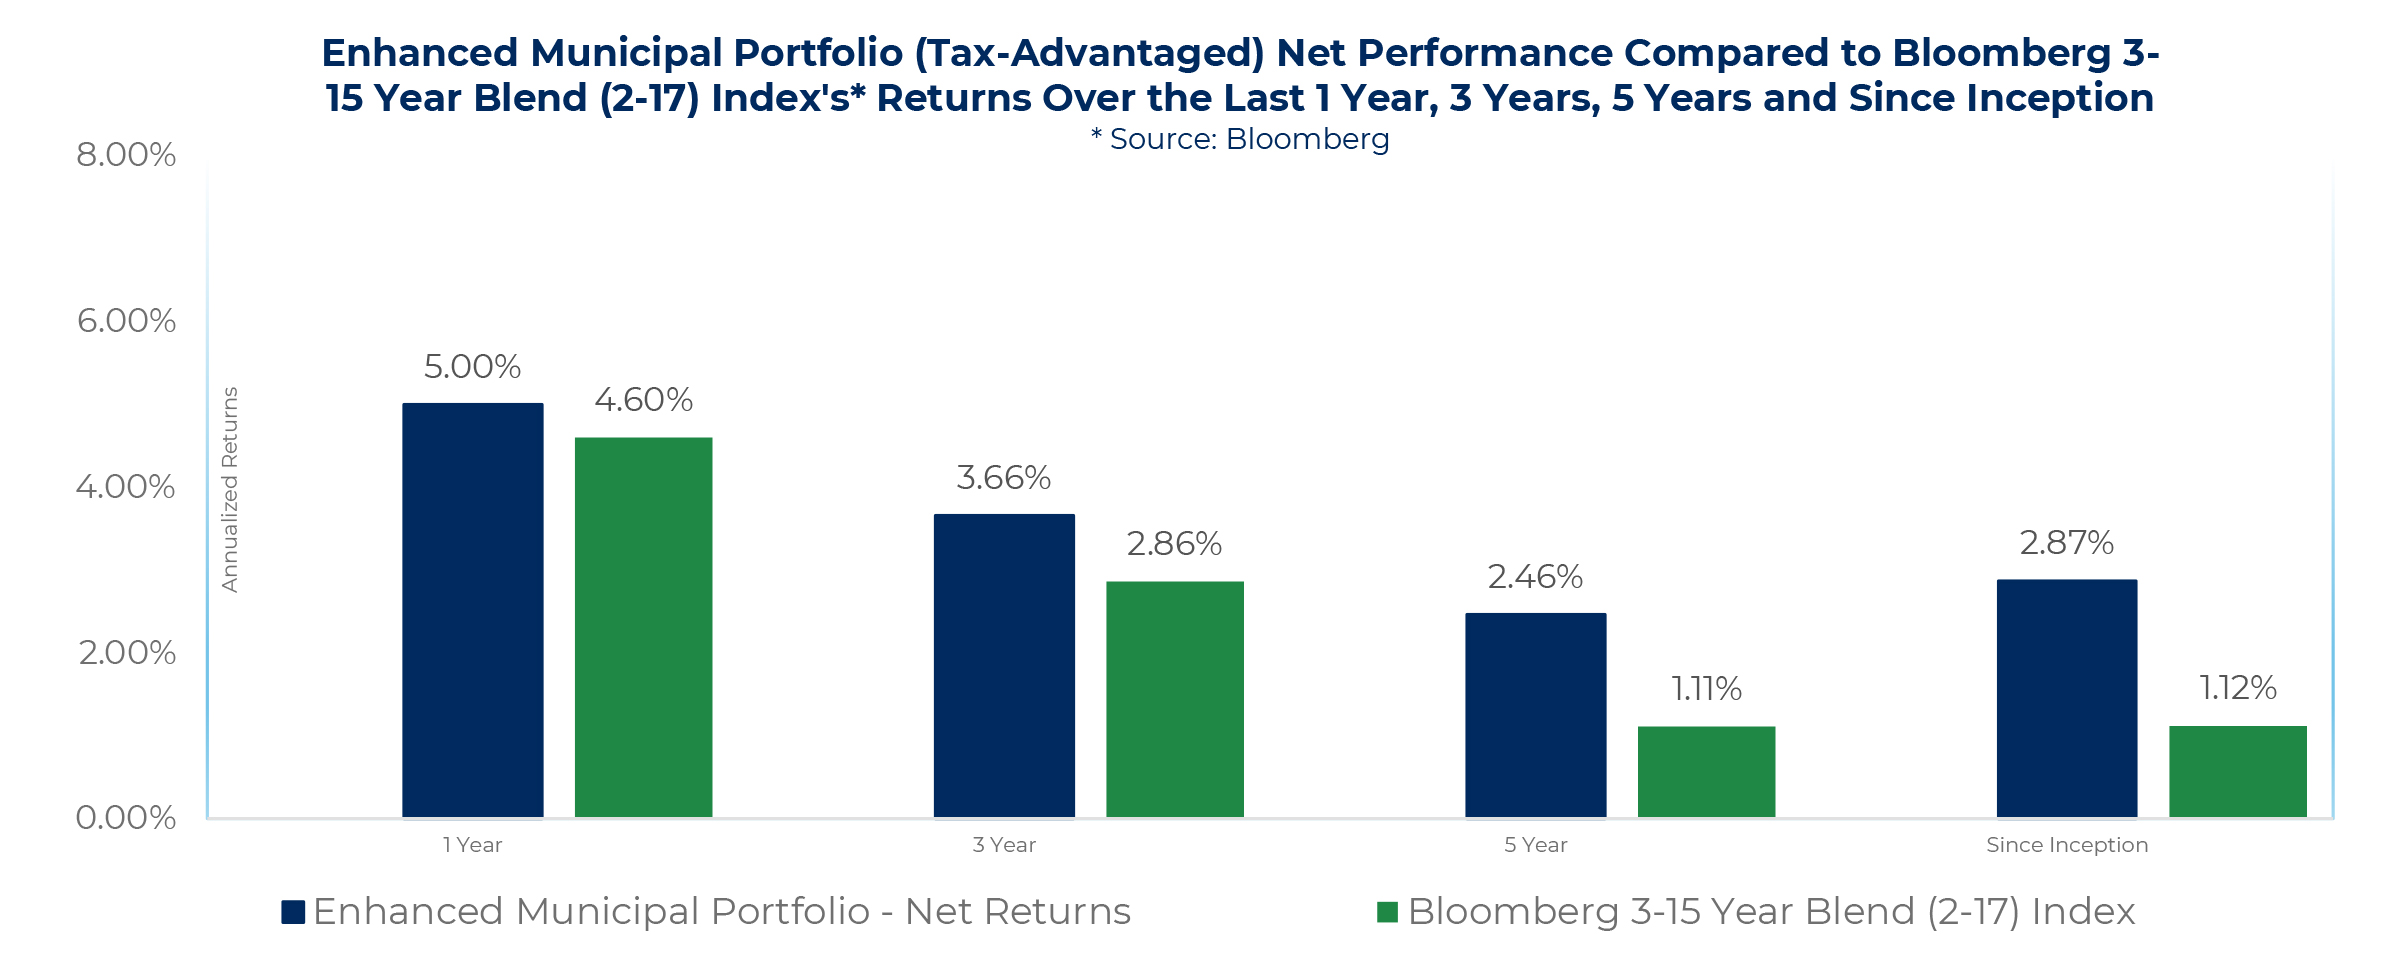
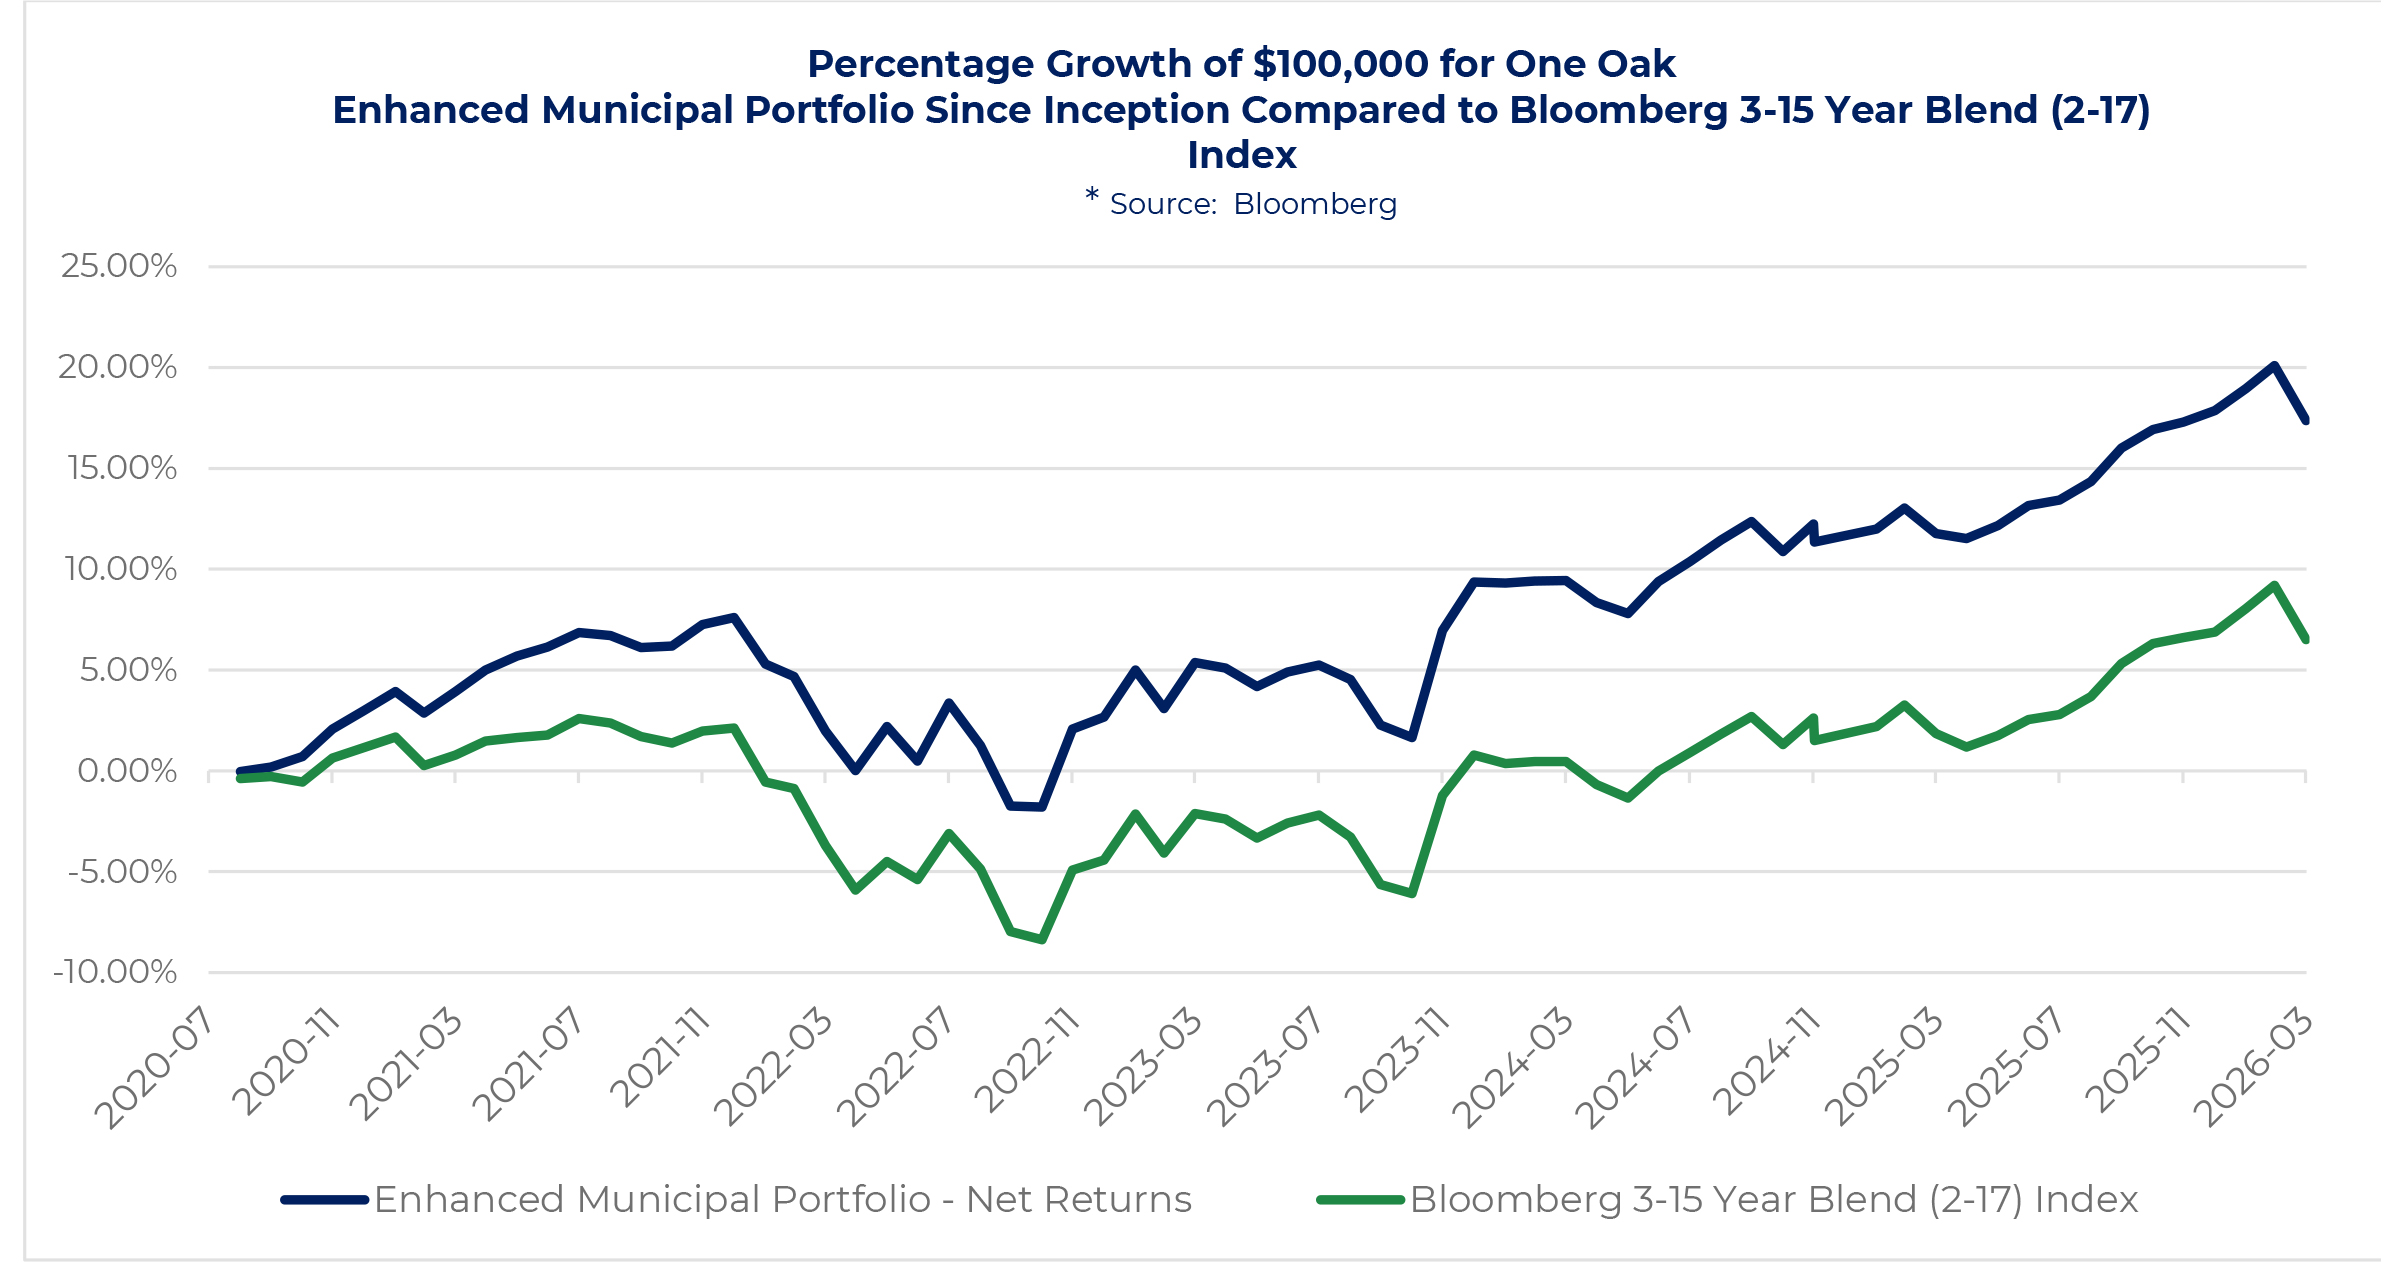
1 Source: Bloomberg 3-15 Year Blend (2-17) Index
In tax-exempt separately managed accounts, the outlook for 2026 emphasizes active management and credit selection, amid potential heavy issuance and evolving rate expectations. Municipals still offer compelling tax-equivalent yields, but valuation dispersion will potentially reward managers who can differentiate across states, sectors, and structures. Separately managed accounts are positioned to benefit from continued investor interest in transparency, customization, and disciplined credit analysis, particularly as supply remains elevated and policy uncertainties persist going into and through the 2026 midterm elections.
In taxable municipal separately managed accounts, the environment is constructive, with manageable new issuance, normalized spreads, and demand from institutional investors seeking high-quality yield within corporate-comparable frameworks. The short-duration tax-exempt municipal bond market also offers a compelling blend of capital preservation, income generation, and tactical liquidity, remaining relevant as short maturities tend to be less sensitive to interest-rate volatility and more anchored to front-end monetary policy expectations.
The municipal market in the first quarter of 2026 was defined by a shift from strong technical support to a more challenging, rate-driven environment. Early-quarter reinvestment demand and manageable issuance provided a constructive backdrop; however, conditions weakened as U.S. Treasury yields moved higher, supply increased, and fund flows turned negative. This combination led to higher municipal yields, modest curve steepening, and broader spread pressure, creating more attractive entry points across the curve by quarter-end.
Against this backdrop, the SMA composite returned -0.42% net of fees for the quarter, compared to -0.34% for the benchmark. Performance reflected the impact of rising rates on high-quality holdings, while the strategy remained focused on disciplined credit selection and long-term income generation. The portfolio was actively repositioned through selective extension, structure optimization, and tax-loss harvesting, improving overall yield and forward return potential. Current positioning emphasizes high-quality exposure and the ability to capitalize on a market that has repriced meaningfully.
The year began with strong seasonal reinvestment flows and stable market conditions, as January coupon and maturity proceeds provided a supportive technical backdrop. Weekly issuance remained manageable at approximately $6–8 billion, allowing demand to absorb supply efficiently. U.S. Treasury yields were stable, with the 10-year trading near 4.10%–4.20%, while front-end yields remained anchored near 4.00%.
We were able to sell into inquires for January reinvestment cash, taking advantage of strong bid-side demand to reposition holdings and selectively upgrade structure where appropriate.
Market conditions became more volatile in February as Treasury yields moved toward the upper end of their quarterly range, with the 10-year approaching 4.30% and the long end showing weaker auction demand. At the same time, issuance increased to approximately $10–12 billion per week, pressuring valuations. Fund flows turned modestly negative and demand became more selective. Municipal yields moved higher, with the 10-year AAA yield drifting toward 3.10%–3.15%. Ratios began to normalize and the curve steepened modestly, with longer maturities cheapening more significantly. In response, the portfolio reduced leverage and repositioned risk, extending selectively along the curve where relative value improved, particularly as 30-year ratios approached 90%.
Rising yields created modest price pressure; however, improved reinvestment opportunities allowed for continued deployment into higher-yielding bonds, supporting income generation and maintaining overall portfolio stability.
Market conditions weakened more notably in March as Treasury yields moved toward the higher end of their range, with the 10-year trading near 4.30%–4.35% amid geopolitical uncertainty and persistent inflation concerns. Municipal technicals deteriorated further as fund outflows accelerated and issuance remained elevated, generally exceeding $10 billion per week. AAA 10-year yields moved toward approximately 3.15%, while ratios cheapened into the high 60% to near 70% range.
As yields backed up, the portfolio benefited from diversified positioning and the ability to implement tax-loss harvesting, allowing for reinvestment into higher-yielding securities. This repositioning improved the portfolio’s income profile and created a more attractive entry point for forward returns despite near-term volatility.
Treasury Market - The U.S. Treasury market in the first quarter of 2026 was characterized by heavy issuance, range-bound yields, and a gradual shift toward curve steepening. The 2-year Treasury yield began the quarter near 4.10% and declined modestly into the high 3.80%–3.90% range as markets initially priced in a more aggressive Federal Reserve easing path. However, stronger-than-expected economic data and persistent core inflation pushed yields back toward 4.00% by quarter-end. The 10-year Treasury traded in a relatively tight band between approximately 4.05% and 4.35%, finishing the quarter near 4.20%, while the 30-year yield fluctuated between 4.30% and 4.60%, reflecting ongoing term premium pressure tied to elevated supply.
New issuance remained substantial, with quarterly refunding sizes near historic highs. Auction performance was mixed, particularly at the long end, where bid-to-cover ratios softened and indirect bidder participation was uneven. These dynamics contributed to a modest steepening of the yield curve, with the 2s–10s curve moving from slightly inverted to roughly flat by quarter-end.
Secondary market activity remained orderly but revealed sensitivity to supply shocks. Liquidity conditions were generally stable, though episodic weakness followed larger auction cycles. From a valuation perspective, Treasuries remained anchored by their safe-haven status, but pricing increasingly reflected supply-demand imbalances and fiscal concerns rather than traditional credit risk.
Looking ahead, continued issuance combined with a gradual easing cycle suggests further bear steepening risk in the long end, while front-end rates are likely to drift lower as policy normalization progresses.
Tax-Exempt Municipal Bond Market - The tax-exempt municipal bond market in Q1 2026 operated within a framework of elevated issuance, stable but range-bound interest rates, and resilient credit conditions, with performance closely tied to supply dynamics and SMA-driven demand.
New Issuance - Tax-exempt issuance in the first quarter exceeded seasonal norms, with total quarterly volume estimated in the $115–130 billion range, significantly above long-term averages. January and February were particularly active, with weekly calendars frequently exceeding $10 billion. Issuers accelerated borrowing in anticipation of continued infrastructure needs and lingering tax policy uncertainty.
For SMAs, this surge in supply created meaningful relative value opportunities, particularly in the 5- to 15-year portion of the curve. Larger benchmark deals generally priced with concessions of 5–10 basis points versus the AAA curve, while smaller or less liquid transactions required wider spreads to clear.
Interest Rates - Municipal yields tracked Treasury movements but were influenced more heavily by supply-demand technicals. The AAA municipal benchmark curve (as measured by MMD) saw relatively modest movements compared to Treasuries.
Municipal-to-Treasury ratios remained attractive:
The curve experienced modest steepening, driven by anchored front-end demand and heavier supply in intermediate and longer maturities.
Secondary Activity - Secondary trading activity was robust, particularly in high-grade, liquid names favored by SMA accounts. Early-quarter reinvestment flows supported strong bid-side demand, especially in bonds maturing inside 10 years.
However, during peak issuance weeks, bid-ask spreads widened by approximately 2–5 basis points in intermediate maturities and more in longer maturities. Dealer inventories increased temporarily but normalized as demand returned. SMAs played a key role in absorbing supply, often stepping in where mutual funds were more constrained.
Trading volumes remained elevated, with a shift toward relative value positioning rather than liquidity-driven selling, particularly as investors rotated into higher-yielding structures.
Notable Market Events - Several factors influenced market tone. Ongoing tax policy discussions, particularly in the context of upcoming midterm elections, contributed to elevated issuance and cautious investor sentiment. At the same time, geopolitical tensions and tariff-related uncertainty reinforced municipals’ appeal as a defensive asset class.
The Federal Reserve’s measured approach to rate cuts provided stability but limited the magnitude of municipal price appreciation, particularly in longer maturities.
Credit Conditions - Credit conditions remained exceptionally strong. State and local governments maintained reserve levels averaging approximately 14%–16% of expenditures, and rating agency activity continued to show upgrades modestly outpacing downgrades.
Credit Spreads remained tight and stable:
Valuation was driven more by technical factors than credit concerns. Periodic cheapening during issuance surges pushed AAA yields 10–20 basis points above recent tights, creating attractive entry points for SMAs. The municipal yield curve steepened modestly, with front-end rates anchored by reinvestment demand and expectations of Fed easing, while longer maturities reflected supply pressure and term premium adjustments.
Looking ahead to Q2 and the balance of 2026, the market is expected to remain supported by strong credit fundamentals, continued SMA demand, and favorable tax-equivalent yields, though elevated issuance will continue to create episodic volatility. Active management will remain critical to capturing relative value and navigating supply-driven dislocations

1 Inception date is August 1, 2020


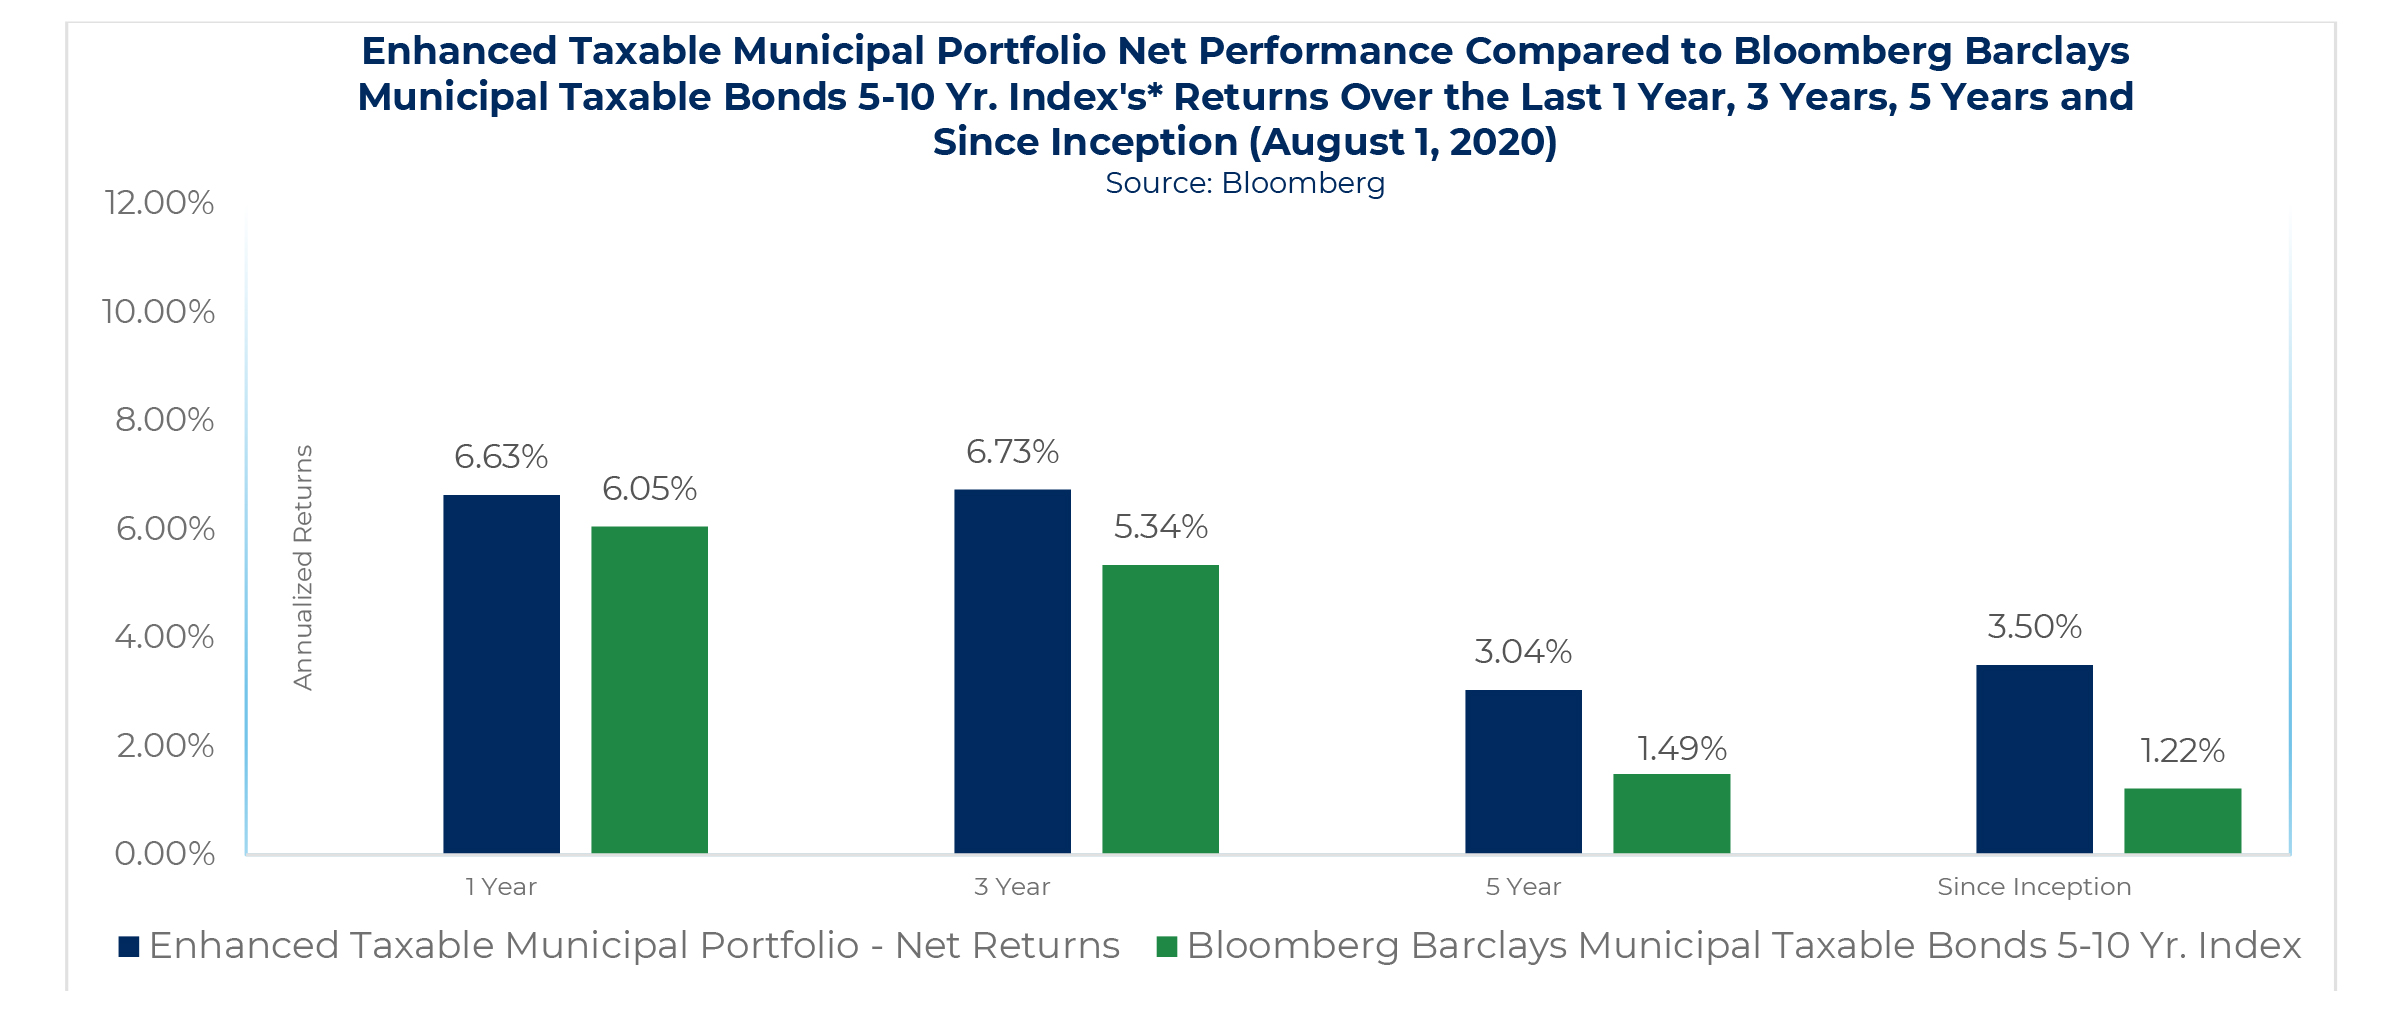
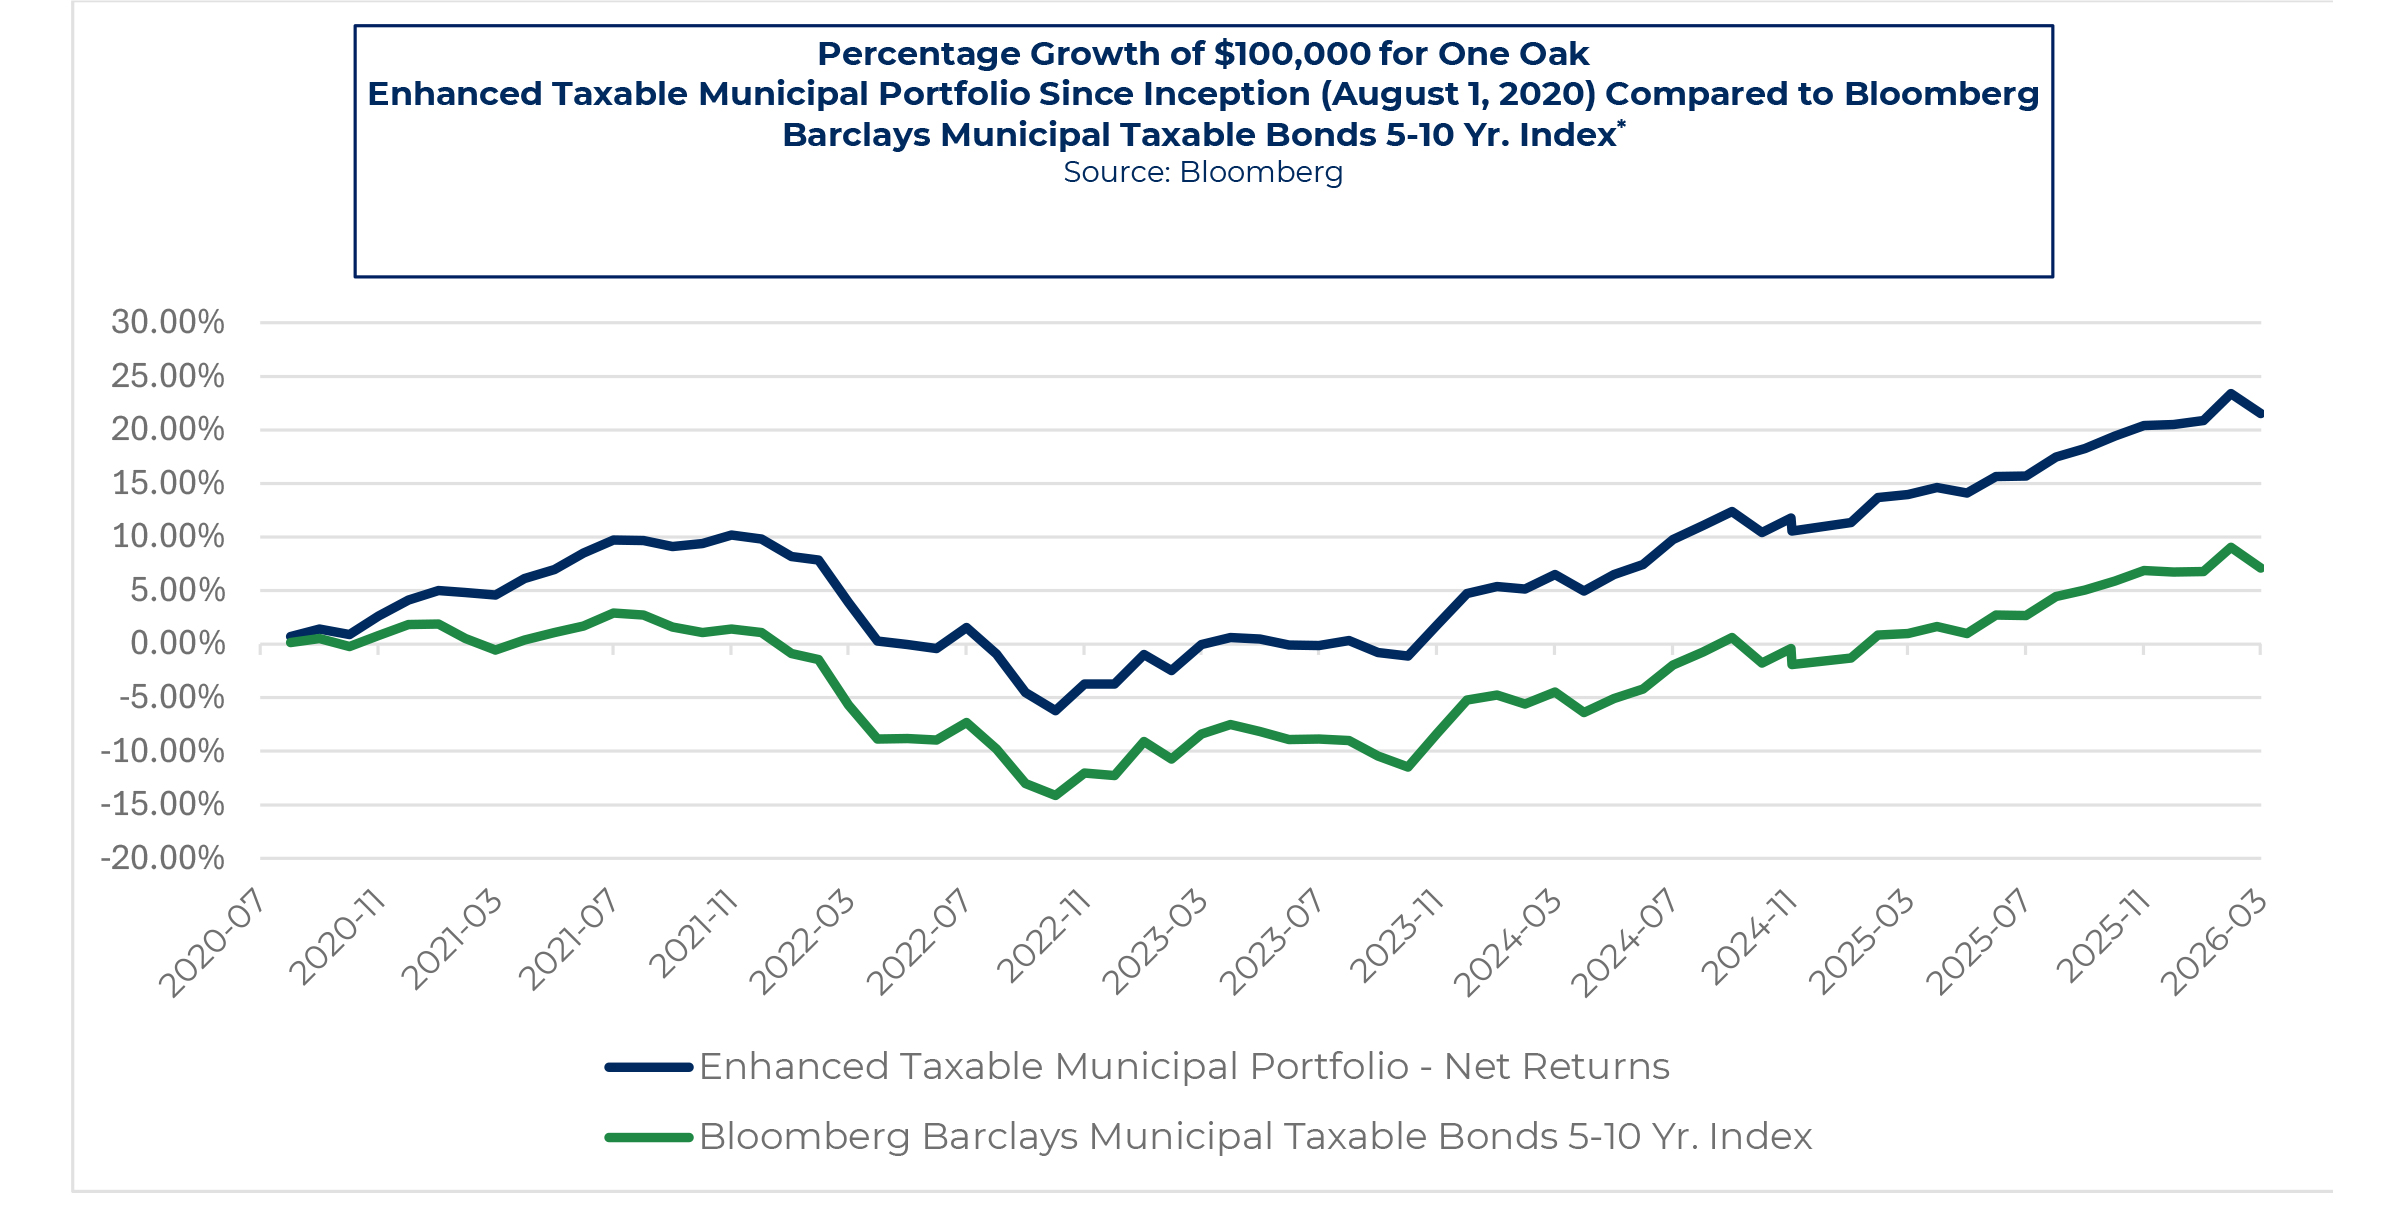
1 Inception date is August 1, 2020 (inception to date returns are annualized)
2 Source: Bloomberg Barclays Municipal Taxable Bonds 5-10 Yr. Index
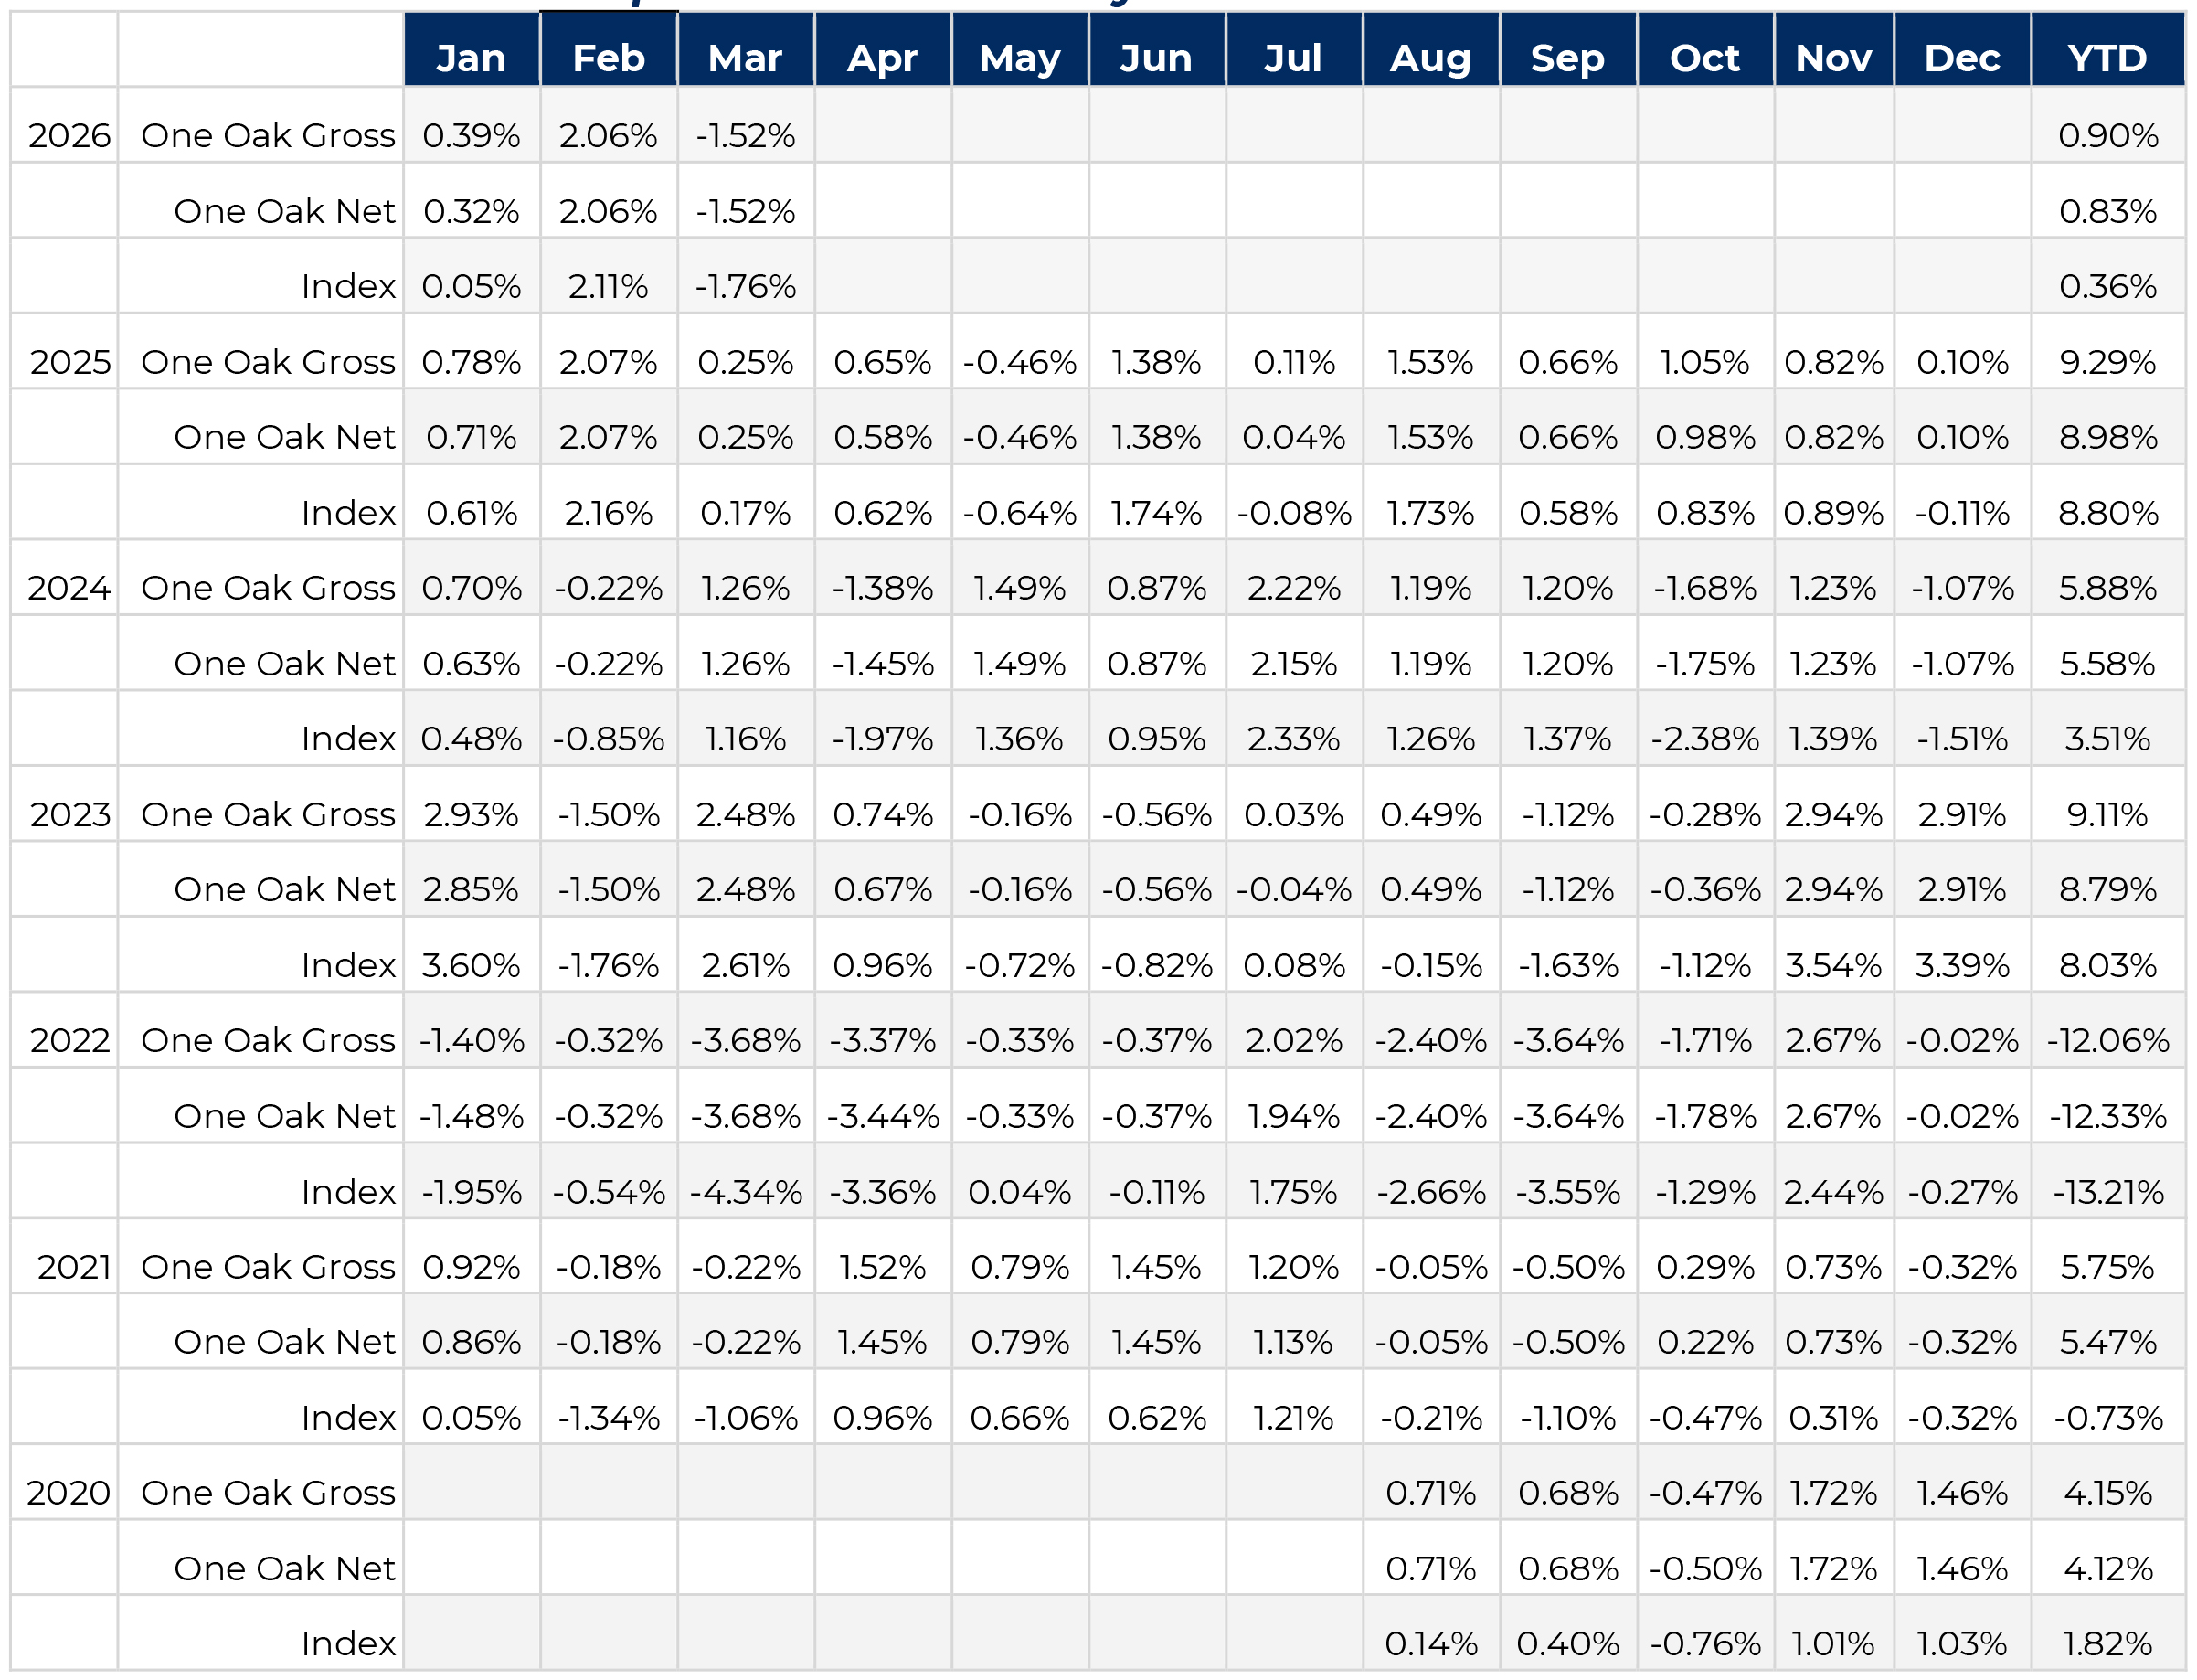
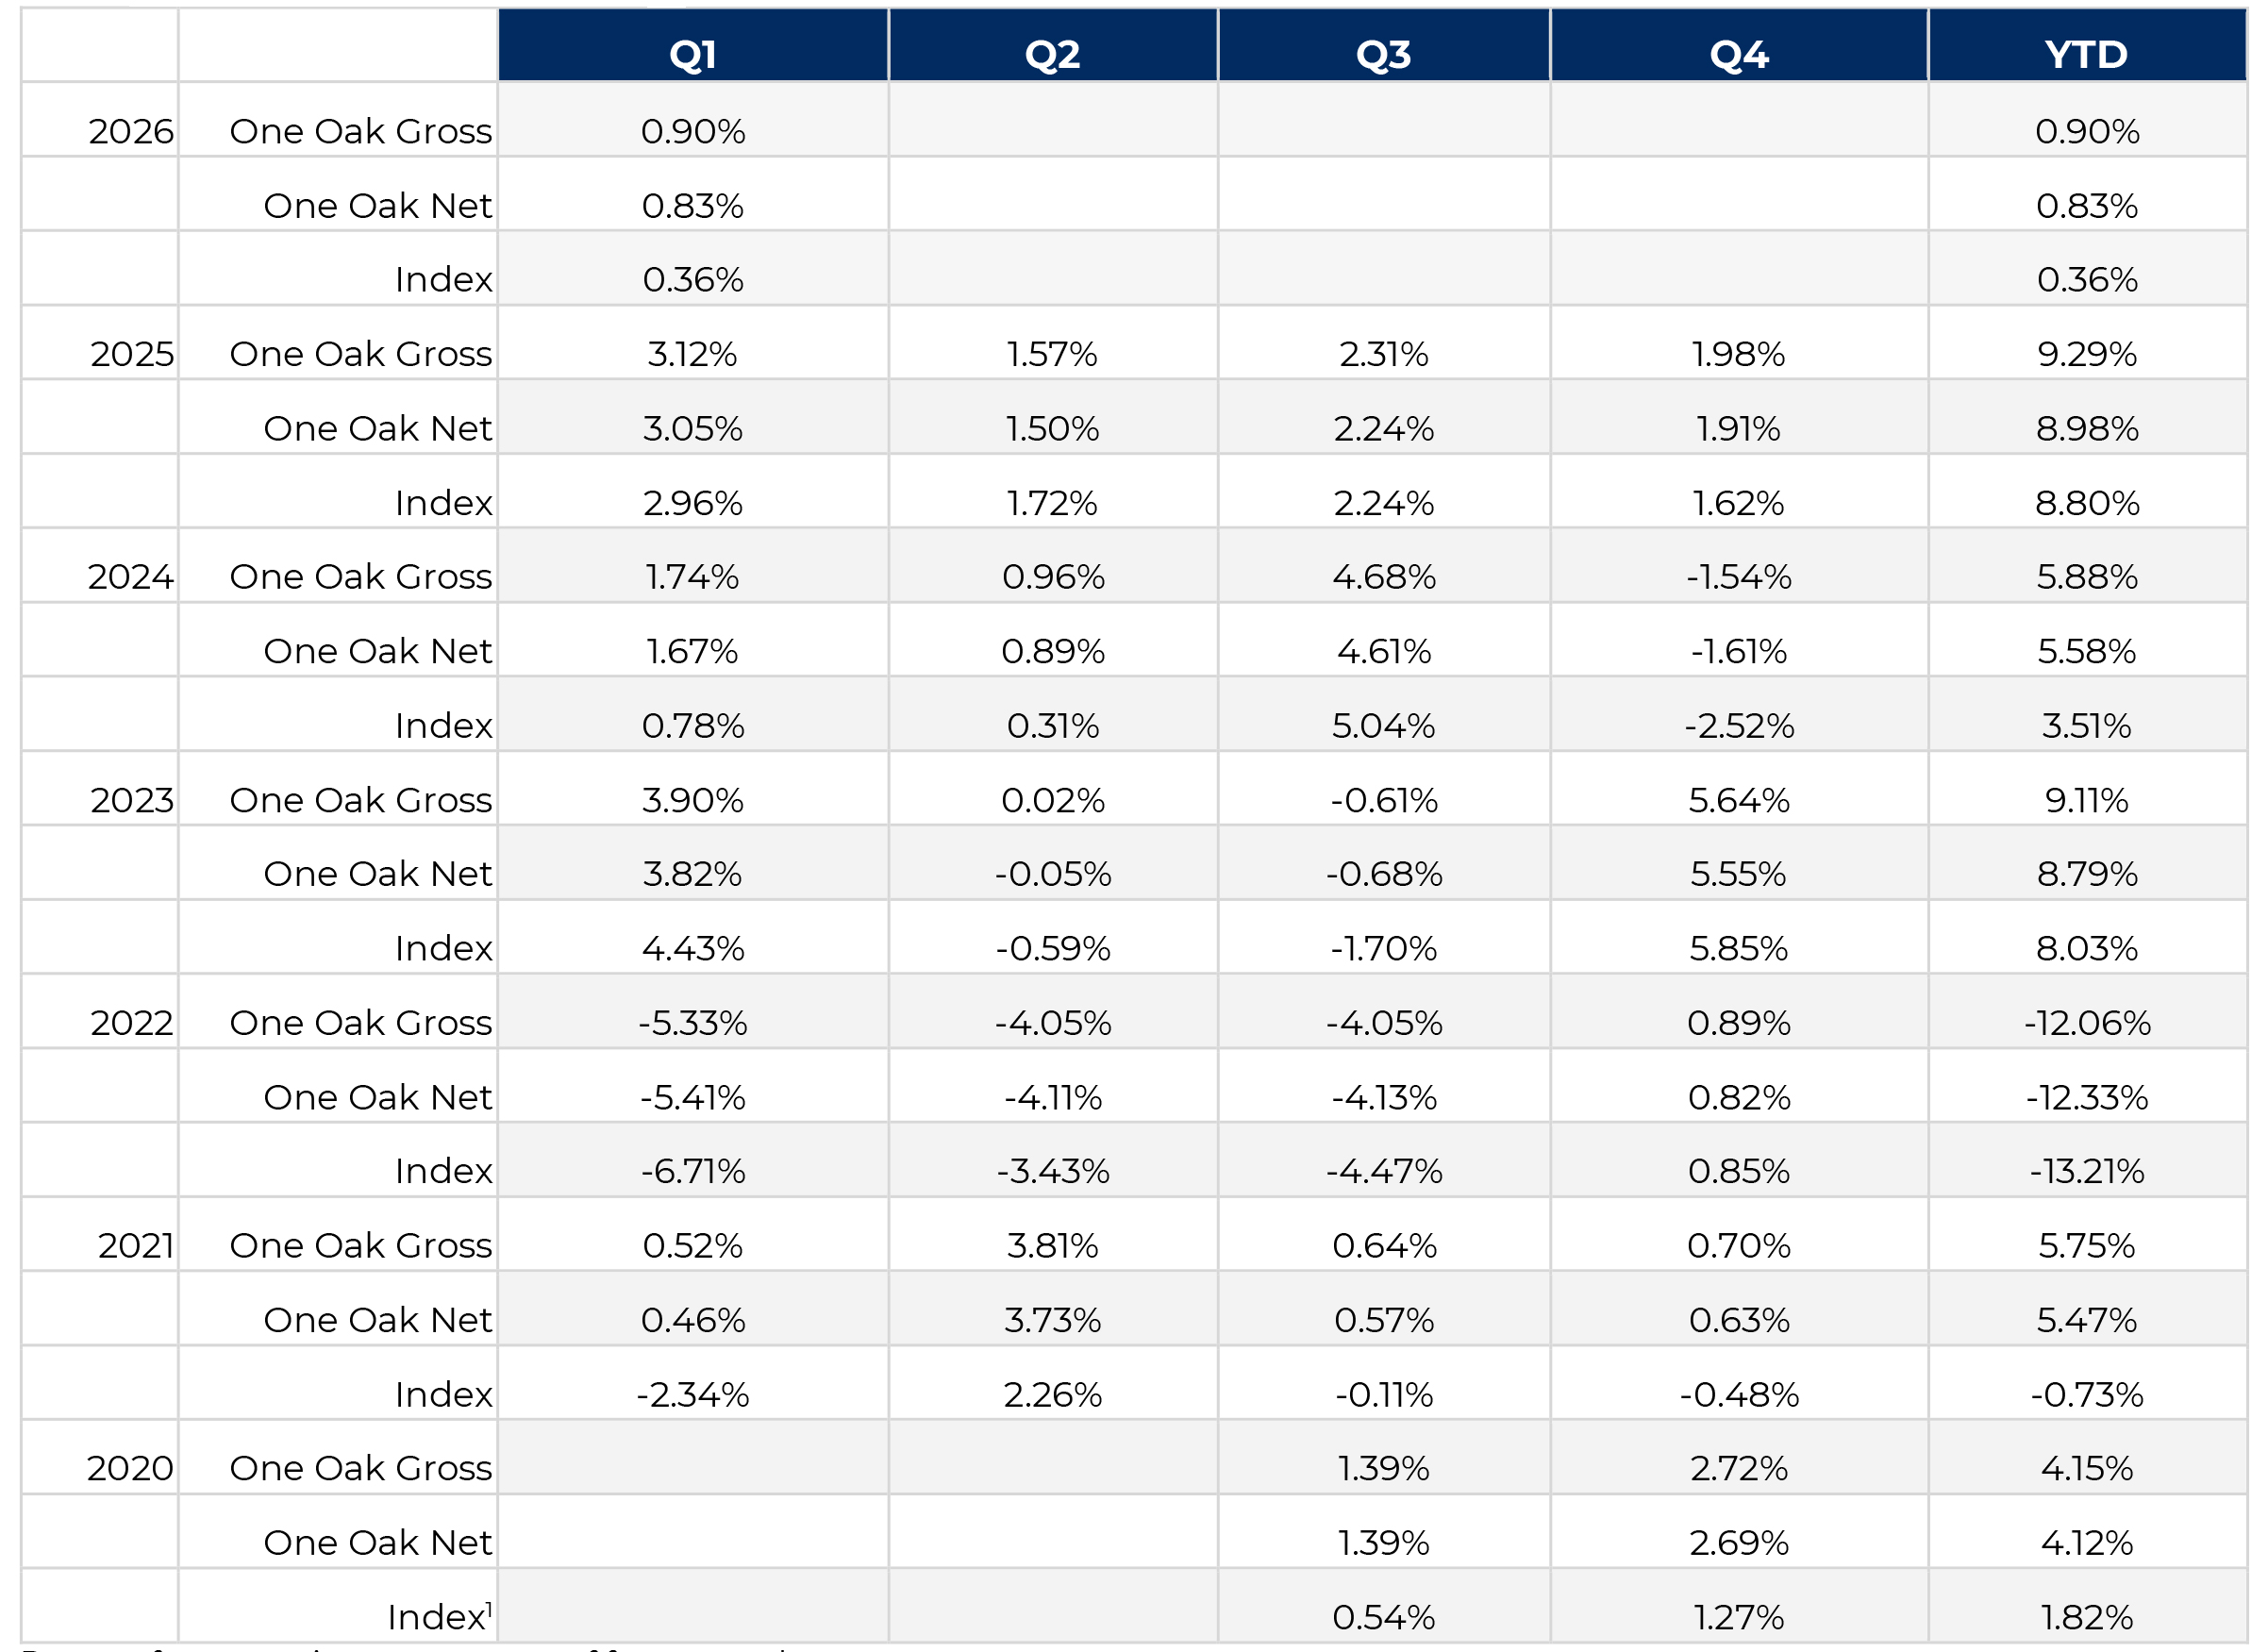
Past performance is no guarantee of future results.
1Source: Bloomberg
The taxable municipal market in the first quarter of 2026 demonstrated notable resilience, largely tracking movements in U.S. Treasuries within a stable technical backdrop. Limited primary issuance and consistent institutional demand supported valuations throughout the quarter, even as Treasury yields moved higher. While rates drove higher absolute yields, taxable municipals remained well bid, with spreads versus corporates gradually widening from near parity to a modest advantage, particularly in longer maturities, enhancing relative value without meaningful dislocation.
Within this environment, the SMA composite generated a net return of 0.83%, outperforming the benchmark return of 0.36% for the quarter. Performance was driven by disciplined credit selection, active secondary market participation, and the ability to add high-quality bonds at improved spreads as relative value evolved. The strategy maintained a focus on durable income generation and structural flexibility, selectively adding exposure at higher yields while preserving credit quality. Current positioning reflects enhanced portfolio income and a continued emphasis on capturing incremental spread in a market offering attractive value relative to corporates.
January 2026 The year began with stable market conditions and limited new issuance, as taxable municipal supply remained constrained relative to historical norms. This created a firm technical backdrop, with consistent institutional demand and limited availability of attractive high-quality bonds. U.S. Treasury yields were stable, with the 10-year trading near 4.10%–4.20%, while front-end yields remained anchored near 4.00%.
In a supply constrained environment, we were actively bidding on bonds in the secondary market, while also taking advantage of strong demand to sell into bid side interest.
February 2026 Market conditions became more volatile in February as Treasury yields moved toward the upper end of their quarterly range, with the 10-year approaching 4.30% and the long end showing weaker auction demand. While taxable municipal supply remained relatively limited, investor demand became more selective as rate volatility increased.
Taxable municipal yields moved higher in line with Treasuries, while spreads versus corporates began to widen modestly, particularly in longer maturities. After starting the year near parity with corporates, taxable municipals moved to a modest spread advantage of approximately 10–20 basis points, creating improved relative value opportunities. Performance benefited from exposure as relative value improved, while continued activity in the secondary market allowed us to selectively add bonds at wider spreads and more attractive yields.
March 2026 Market conditions weakened more notably in March as Treasury yields moved toward the higher end of their range, with the 10-year trading near 4.30%–4.35% amid geopolitical uncertainty and persistent inflation concerns. Market volatility increased across fixed income, though taxable municipal supply remained limited and secondary activity became more pronounced.
As rates moved higher, we remained active in the secondary market, taking advantage of dislocations to add high-grade bonds at more attractive spreads. This allowed the portfolio to enhance yield and improve overall positioning without sacrificing credit quality. Retail participation remained firm, particularly for high-grade securities, allowing us to efficiently reposition holdings and improve overall portfolio structure.
Treasury Market - The U.S. Treasury market in the first quarter of 2026 was characterized by heavy issuance, range-bound yields, and a gradual shift toward curve steepening. The 2-year Treasury yield began the quarter near 4.10% and declined modestly into the high 3.80%–3.90% range as markets initially priced in a more aggressive Federal Reserve easing path. However, stronger-than-expected economic data and persistent core inflation pushed yields back toward 4.00% by quarter-end. The 10-year Treasury traded in a relatively tight band between approximately 4.05% and 4.35%, finishing the quarter near 4.20%, while the 30-year yield fluctuated between 4.30% and 4.60%, reflecting ongoing term premium pressure tied to elevated supply.
New issuance remained substantial, with quarterly refunding sizes near historic highs. Auction performance was mixed, particularly at the long end, where bid-to-cover ratios softened and indirect bidder participation was uneven. These dynamics contributed to a modest steepening of the yield curve, with the 2s–10s curve moving from slightly inverted to roughly flat by quarter-end.
Secondary market activity remained orderly but revealed sensitivity to supply shocks. Liquidity conditions were generally stable, though episodic weakness followed larger auction cycles. From a valuation perspective, Treasuries remained anchored by their safe-haven status, but pricing increasingly reflected supply-demand imbalances and fiscal concerns rather than traditional credit risk.
Looking ahead, continued issuance combined with a gradual easing cycle suggests further bear steepening risk in the long end, while front-end rates are likely to drift lower as policy normalization progresses.
Taxable Municipal Bond Market - The taxable municipal bond market in Q1 2026 was defined by limited new issuance, improving relative value versus corporates, and stable credit conditions, with strong participation from institutional investors and SMA strategies.
New Issuance - Taxable municipal issuance remained muted relative to historical norms, with quarterly volume estimated in the $25–35 billion range. Issuers continued to favor tax-exempt structures where possible, leaving taxable issuance concentrated in sectors such as transportation, higher education, and taxable refunding-constrained credits.
This limited supply created a favorable technical backdrop. New issues generally priced with modest concessions of 5–15 basis points versus secondary levels, particularly in longer maturities. For SMAs, the constrained supply environment required a disciplined and opportunistic approach, often relying more heavily on secondary market sourcing.
Interest Rates - Taxable municipal yields closely tracked Treasury movements but retained a spread premium. During Q1:
Spreads versus Treasuries were relatively stable:
Relative to investment-grade corporates, taxable municipals moved from slightly rich to modestly wide:
Secondary Activity - Secondary market activity improved steadily throughout the quarter. Early in Q1, liquidity was somewhat constrained due to limited dealer balance sheet capacity, but conditions normalized as investor demand strengthened.
Institutional buyers, particularly insurance companies, pension funds, and foreign investors, were active participants. SMA accounts also played a growing role, particularly in sourcing longer-duration assets with favorable spread characteristics.
Bid-ask spreads remained relatively tight:
Trading activity increasingly reflected relative value positioning, as investors rotated out of tight corporate spreads into taxable municipals offering incremental yield.
Notable Market Events - Macro developments influenced market tone throughout the quarter. Continued geopolitical tensions and tariff-related uncertainty reinforced demand for high-quality fixed income. At the same time, shifting expectations around Federal Reserve policy created intermittent volatility.
The relative cheapening of taxable municipals versus corporates in the second half of the quarter was a notable development, attracting crossover demand and improving liquidity conditions.
Credit Conditions - Credit conditions in the taxable municipal market remained strong and stable, supported by high-quality issuers and robust underlying fundamentals. Default risk remained negligible, and rating agency actions continued to show a bias toward upgrades, particularly among essential-service and state-backed issuers.
Credit spreads were well contained:
Valuation trends improved during the quarter. After beginning the year somewhat rich versus corporates, taxable municipals cheapened to levels offering incremental yield of 10–20 basis points versus similarly rated corporate bonds, particularly in long maturities.
The yield curve steepened modestly, reflecting:
For SMAs, this environment was particularly attractive. The combination of limited supply, stable credit, and improving relative value created opportunities to build long-duration exposure at yields exceeding 5% with strong credit backing.
Looking ahead to Q2 and the remainder of 2026, taxable municipals are well positioned to benefit from continued institutional demand, constrained supply, and stable credit conditions. While spread tightening may be limited by broader market dynamics, the sector offers compelling value as a complement to corporate credit in diversified fixed income portfolios.

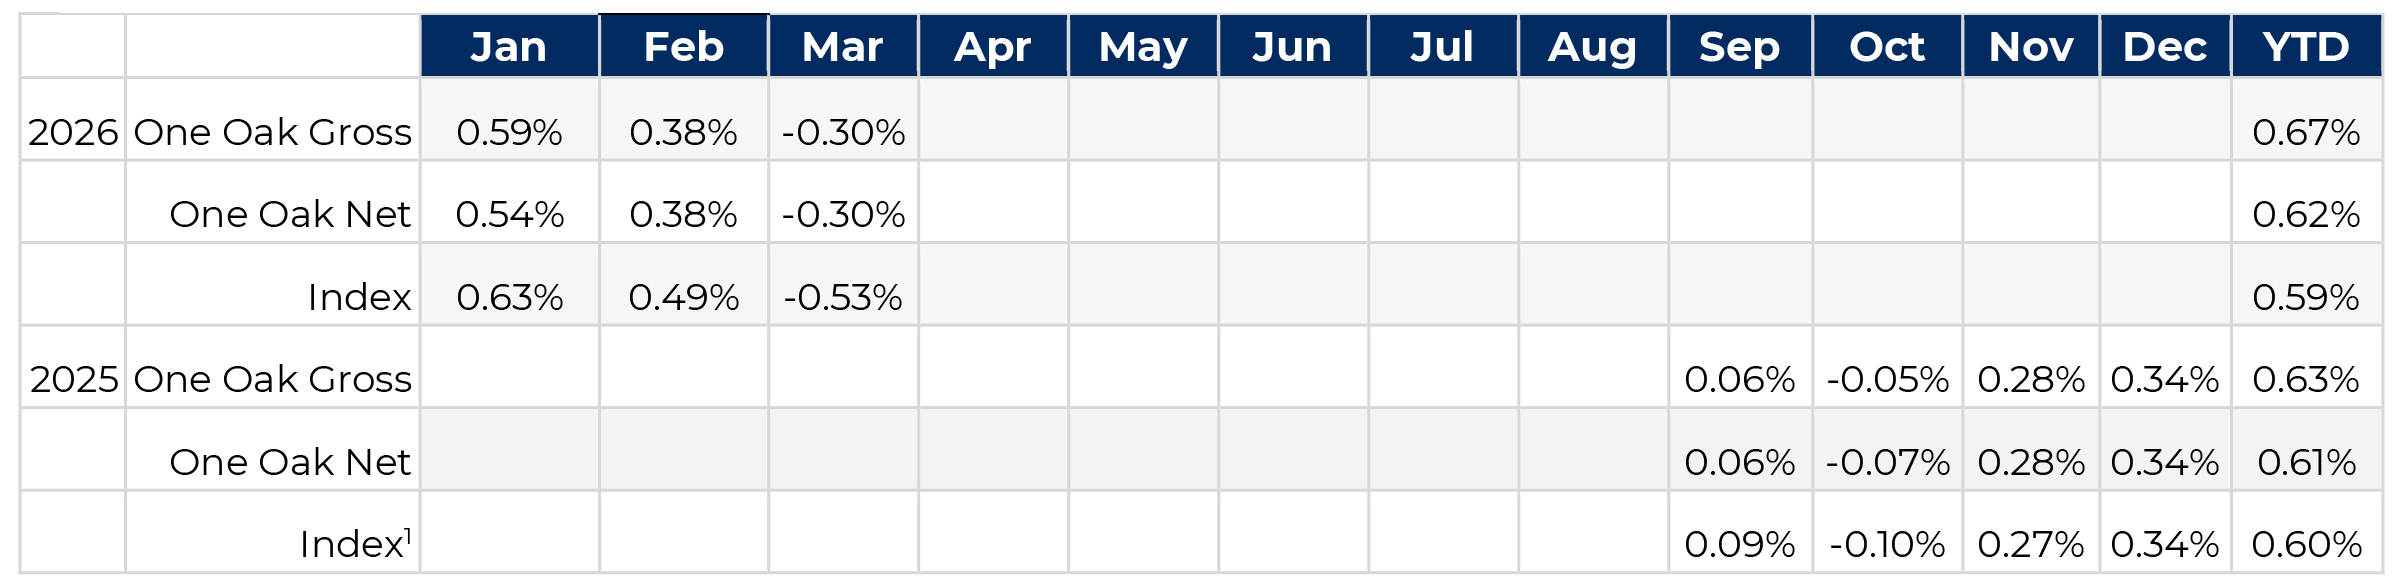
Inception date is September 1, 2025
1Source: Bloomberg Muni 1-3 Yr. Total Return Index

Past performance is no guarantee of future results.
1Source: Bloomberg Muni 1-3 Yr. Total Return Index
The short-duration tax-exempt municipal market in the first quarter of 2026 remained fundamentally stable and resilient, supported by consistent reinvestment demand and manageable issuance. Front-end Treasury yields held in a tight range near 4.00%, anchoring short-term municipal rates and limiting volatility across the segment. While broader fixed income markets experienced periods of rate movement and uncertainty, short-duration municipals continued to benefit from strong technical support and steady demand for high-quality, liquid paper.
Within this environment, the SMA composite generated a net return of 0.62% versus 0.59% for the benchmark over the quarter. Performance was driven by steady tax-exempt income and disciplined portfolio construction within a high-grade, laddered structure. The strategy’s emphasis on liquidity, credit quality, and limited turnover helped maintain consistency through varying rate conditions, reinforcing its role as a stable, income-oriented allocation within client portfolios.
The year began with strong seasonal reinvestment flows and stable market conditions, as January coupon and maturity proceeds provided a supportive technical backdrop. Weekly issuance remained manageable, allowing demand to absorb supply efficiently. U.S. Treasury yields in the front end were stable, with the 1–2-year portion of the curve anchored near 4.00%.
Performance was driven primarily by income generation from a portfolio of high-quality, short-duration municipal bonds. Given the strong technical backdrop and limited volatility, the strategy remained focused on maintaining a consistent laddered structure and high credit quality.
Market conditions became more mixed in February as front-end Treasury yields drifted modestly lower before stabilizing, while reinvestment flows remained supportive but began to normalize. Issuance remained steady, and demand for high-quality short-duration bonds continued, though investor behavior became more selective.
Short-term municipal yields remained relatively stable, with modest fluctuations driven by Treasury movements and ongoing reinvestment demand. The front end of the curve experienced slight flattening, with limited volatility compared to longer maturities. Performance continued to be supported by stable income and low-price volatility. The portfolio maintained its focus on high-grade credits and a disciplined ladder, with minimal turnover.
Market conditions remained relatively resilient in March despite increased volatility in longer-duration fixed income markets. Front-end Treasury yields were largely stable, with modest upward pressure late in the month as broader market uncertainty increased. Reinvestment demand remained a key technical driver, supporting valuations in short-duration municipals.
Short-term municipal yields moved modestly higher but remained well anchored relative to longer maturities. Liquidity conditions remained strong, with continued demand for high-grade, short-dated bonds. The strategy remained focused on preserving capital and generating consistent tax-exempt income, reinforcing its role as a stable component within a broader fixed income allocation.
Short Duration Treasury Market (1–3 Years) - The front end of the U.S. Treasury curve in the first quarter of 2026 reflected the transition from restrictive monetary policy toward a measured easing cycle, while remaining anchored by still-elevated policy rates. The 1-year Treasury yield began the quarter near 4.20% and declined into a range of approximately 3.90%–4.00% before stabilizing near 4.00% by quarter-end. The 2-year Treasury yield followed a similar trajectory, trading between roughly 3.85% and 4.10%, reflecting ongoing uncertainty regarding the timing and magnitude of Federal Reserve rate cuts.
New issuance in the 1–3-year sector remained elevated, with strong bill and note supply driven by Treasury’s funding needs and cash management requirements. However, demand remained robust, particularly from money market funds, banks, and short-duration mandates, resulting in consistently solid auction outcomes and limited volatility relative to longer maturities.
Secondary market activity in the front end was highly liquid and efficient. Bid-ask spreads remained tight, typically within 1–2 basis points, and turnover was high as investors actively managed cash positions and adjusted duration exposure. The front end continued to serve as the primary transmission mechanism for Fed policy expectations.
From a valuation perspective, front-end yields remained attractive on both an absolute and risk-adjusted basis. The yield curve within the 1–3-year range began to modestly flatten, reflecting expectations that policy rates will decline gradually through 2026. Looking ahead, front-end yields are likely to drift lower as rate cuts materialize, reinforcing the importance of locking in yields early in the easing cycle.
Short Duration Municipal Bond Market (1–3 Years) - The short-duration municipal bond market in Q1 2026 was characterized by strong demand, elevated reinvestment flows, stable credit conditions, and a gradual adjustment to declining front-end yields, with particularly important implications for SMA strategies.
New Issuance - Short-duration municipal issuance, primarily in bonds maturing within 1–3 years, as well as callable structures and notes, remained steady but not excessive. Quarterly supply was estimated in the $30–40 billion range for front-end maturities, representing a manageable share of total issuance.
Issuers continued to utilize short-dated structures for liquidity management and interim financing, particularly in sectors such as education, transportation, and state general obligations. New issues in this maturity range typically priced at yields 5–15 basis points above comparable AAA benchmarks, reflecting modest concessions needed to attract SMA and short-duration buyers.
For SMA accounts, this environment provided a consistent pipeline of reinvestment opportunities, particularly as maturing bonds and called securities generated cash that needed to be redeployed.
Interest Rates - Short-term municipal yields closely tracked front-end Treasury movements but remained influenced by reinvestment demand and tax-equivalent considerations. During Q1:
Municipal-to-Treasury ratios in the short end remained firm:
The short end of the municipal curve exhibited mild flattening, as yields declined in anticipation of Fed easing while reinvestment demand kept absolute yields relatively well supported.
Secondary Activity - Secondary trading conditions in the short-duration municipal market were highly liquid and efficient, particularly for high-grade, frequently traded names favored by SMAs. Bid-ask spreads remained tight, generally within 1–3 basis points, even during periods of broader market volatility.
Reinvestment flows, particularly from January and February maturities and coupons, provided strong bid-side support. SMA accounts were dominant participants in this segment, often competing for limited high-quality supply.
Trading activity was characterized by roll-down strategies and yield pickup trades, with investors extending modestly along the curve (e.g., from 1-year to 3-year maturities) to capture incremental income without meaningfully increasing duration risk.
Notable Market Events - Macroeconomic uncertainty, including tariff developments and geopolitical tensions, had limited direct impact on short-duration municipals compared to longer maturities. However, these factors reinforced the attractiveness of front-end municipals as a defensive, income-oriented allocation.
The evolving Federal Reserve outlook was the most important driver, as expectations for rate cuts prompted investors to shift from cash and money market instruments into short-duration municipal bonds to lock in tax-advantaged yields.
Credit Conditions - Credit conditions in the short-duration municipal market remained exceptionally strong. The short maturity profile limited exposure to long-term fiscal uncertainties, and issuers continued to benefit from strong liquidity, stable revenues, and elevated reserve levels.
Credit spreads in the front end were extremely tight and stable:
Valuation remained compelling on a tax-equivalent basis, particularly for high-net-worth investors. Even after modest yield declines, 2–3-year municipal bonds continued to offer tax-equivalent yields competitive with or exceeding taxable alternatives.
The short-end municipal yield curve exhibited slight flattening, driven by declining front-end yields and strong reinvestment demand anchoring shorter maturities. This environment is particularly favorable for SMA strategies, which can optimize laddering and capture incremental yield through disciplined reinvestment.
Looking ahead to Q2 and the remainder of 2026, short-duration municipals are well positioned to benefit from continued rate cuts, strong reinvestment flows, and persistent SMA demand. While yields are expected to decline gradually, the ability to lock in attractive tax-exempt income early in the easing cycle remains a key advantage for investors.
Until next time,
Stephen DiTursi, CEO, CIO
(914) 205-5821
sditursi@oneoakcapitalmgmt.com
Neil Crabb, Senior Portfolio Manager
(914) 205-5825
ncrabb@oneoakcapitalmgmt.com
One Oak Capital Management is an SEC-registered investment adviser and manager of separately managed portfolios. Registration as an investment adviser does not imply a level of skill or training. This presentation is not an offer to sell, or the solicitation of an offer to purchase, any investment managed or sponsored by One Oak Capital Management or any of its affiliated entities (collectively, “One Oak”). The index shown is provided for illustrative purposes only, is unmanaged, reflects the reinvestment of income and dividends, and does not reflect the impact of advisory fees. Investors cannot invest directly in an index. Comparisons to indices have limitations because indices have volatility and other material characteristics that may differ from a particular OneOak strategy. One Oak's performance may differ substantially from the performance of an index. In addition, data used in the benchmark are obtained from sources considered to be reliable, but One Oak makes no representations or guarantees with regard to the accuracy of such data. The EnhancedMunicipal Portfolio uses active management and is not benchmarked to the index.
Past performance is not representative of future return performance. Net returns are calculated by deducting the highest standard fee from the gross returns on a quarterly basis. The returns reflect the net performance of employing One Oak's highest fee, 0.30% per year to the gross performance. Net returns do not include any additional intermediary fees that may be charged to the end investor. The presentation and the net performance is meant for financial professionals use only and is not intended for distribution to the end users. The returns include the reinvestment of dividends, interest, and other earnings. The information provided was calculated by One Oak Capital Management, LLC using a combination of proprietary and external data sources and has not been audited for accuracy. While interest on municipal bonds is generally exempt from federal income tax, it may be subject to the federal alternative minimum tax, or state or local taxes. Profits and losses on federally tax-exempt bonds may be subject to capital gains tax treatment. Fixed income risks include, but are not limited to, changes in interest rates, liquidity, credit quality, volatility, and duration. One Oak's management fees are deducted each quarter on the first month of the quarter: January, April, July and October. One Oak does not accrue its management fee for the remaining months and therefore the net performances for those months will be higher and does not represent the actual annual net returns.
Due to various risks and uncertainties, actual events, results or the actual performance of the investment may differ materially from those reflected or contemplated in the returns presented within. While assumptions underlying various statements as to the future performance are believed to be reasonable in nature, prospective investors should make their own assessments as to such assumptions and the associated risks, including the likelihood of the strategy achieving the corresponding results. All of which are subject to risks and uncertainties many of which are beyond the control of the investment adviser. As such, no assurance is given as to the realization of any such future performance. No representation or warranty is made as to the future performance or such forward-looking statements. The delivery of this presentation does not imply that any other information contained herein is correct as of any time subsequent to the presentation date. Actual performance results may differ from composite returns, depending on the size of the account, investment guidelines and /or restrictions, inception date, and other factors. One Oak Capital Management, LLC ("One Oak") claims compliance. with the Global Investment Performance Standards (GIPS) and has prepared and presented this report in compliance with the GIPS standards. One Oak has been independently verified for the periods 2019 through 2022.
Fees and yields are calculated by One Oak as of 07/22/25. Prospective investors are encouraged to consult a tax professional before making the decision to invest. Source: Schwab Data as of July 22, 2025. For illustrative purposes only. The framework discussed herein is hypothetical and does not represent the investment performance or the actual accounts of any investors or any funds. The results achieved in our simulations do not guarantee future investment results. It is possible that the actual results of an investor who invests in the manner these projections suggest will be better or worse than the projections, and that an investor may lose money by investing in the manner the projections suggest. The index is included for illustrative purposes only, is not available for direct investment and does not reflect the deduction of fees or expenses which would reduce returns.Actual performance results may differ from composite returns, depending on the size of the account, investment guidelines and /or restrictions, inception date, and other factorsTo invest with One Oak Capital Management LLC, you must be a qualified or accredited investor. Different share classes may have different results. Consult your individual statement.
These materials contained confidential and proprietary information and have been provided with the express understanding that their distribution or the divulgence of any of their contents to any person, other than the person(s) to whom they were originally delivered and such person’s advisors, without the prior consent of One Oak is prohibited.
To invest with One Oak Capital Management LLC, you must be a qualified or accredited investor. Different share classes may have different results. Consult your individual statement.
For more information regarding the Morningstar Rating methodology please visit www.morningstar.com/content/dam/marketing/shared/research/methodology/771945_Morningstar_Rating_for_Funds_Methodology.pdf
The PSN Municipal Universe consists of 213 strategies, across 98 firms. PSN utilizes a proprietary of our clients’ top priority performance screens. PSN Top Guns runs products in six proprietary categories in over 50 universes. This is a highly anticipated ranking and is widely used by institutional asset managers
References made to awards/rankings are not an endorsement by any third party to invest with One Oak and are not indicative of future performance. Investors should not rely on awards/rankings for any purpose and should conduct their own review prior to investing
One Oak Capital Management has done several tax-harvesting trades for the Enhanced and Enhanced Taxable Municipal Portfolio
Logos are protected trademarks of their respective owners and One Oak disclaims any association with them and any rights associated with such trademarks.


