


One Oak Enhanced Municipal Portfolio received a Zephyr’s PSN Top Gun award for having a Top 10 return for the three-year ending June 30, 2026, in the PSN Municipal Universe. The Enhanced Municipal Portfolio also had a R-Squared of 0.80 or greater than the relative benchmark for the recent five-year period, a return greater than the style benchmark for the three latest three-year rolling periods, and a standard deviation for the five-year period equal or less than the median standard deviation for the peer group. The One Oak Enhanced Municipal Portfolio ranked third out of 94 Firms and 210 Products.
One Oak Enhanced Municipal Portfolio received a Zephyr’s PSN Top Gun award for having a Top 10 return for the five-year ending June 30, 2026, in the PSN Municipal Universe. The Enhanced Municipal Portfolio also had a R-Squared of 0.80 or greater than the relative benchmark for the recent five-year period, a return greater than the style benchmark for the three latest three-year rolling periods, a standard deviation for the five-year period equal or less than the median standard deviation for the peer group. The One Oak Enhanced Municipal Portfolio ranked first out of 94 Firms and 210 Products.

1 Inception date is August 1, 2020. Inception date gross and net returns are annualized.
2 Source: Bloomberg

Past performance is no guarantee of future results.
1 Source: Bloomberg 3-15 Year Blend (2-17) Index
Disclaimer: References made to awards/rankings are not an endorsement by any third party to invest in One Oak and are not indicative of future performance. Investors should not rely on awards/rankings for any purpose and should conduct their own review prior to investing. Zephyr/PSN is an asset and wealth management software marketed by Informa (LSE: INF). PSN is a database of Separately Managed Accounts managed by Zephyr. One Oak does not compensate Zephyr for inclusion in the PSN database, nor does it compensate Zephyr for consideration for, or awarding of, the PSN Top Gun designation. The Morningstar Rating for Funds, often called the Star Rating, is a data-driven rating that measures the past performance of a fund in comparison to peers. One Oak has purchased the Morningstar Basics Package, which grants One Oak permission to feature its Morningstar Rating in marketing materials. This purchase, renewed on an annual basis, has a value of $6,885.06.
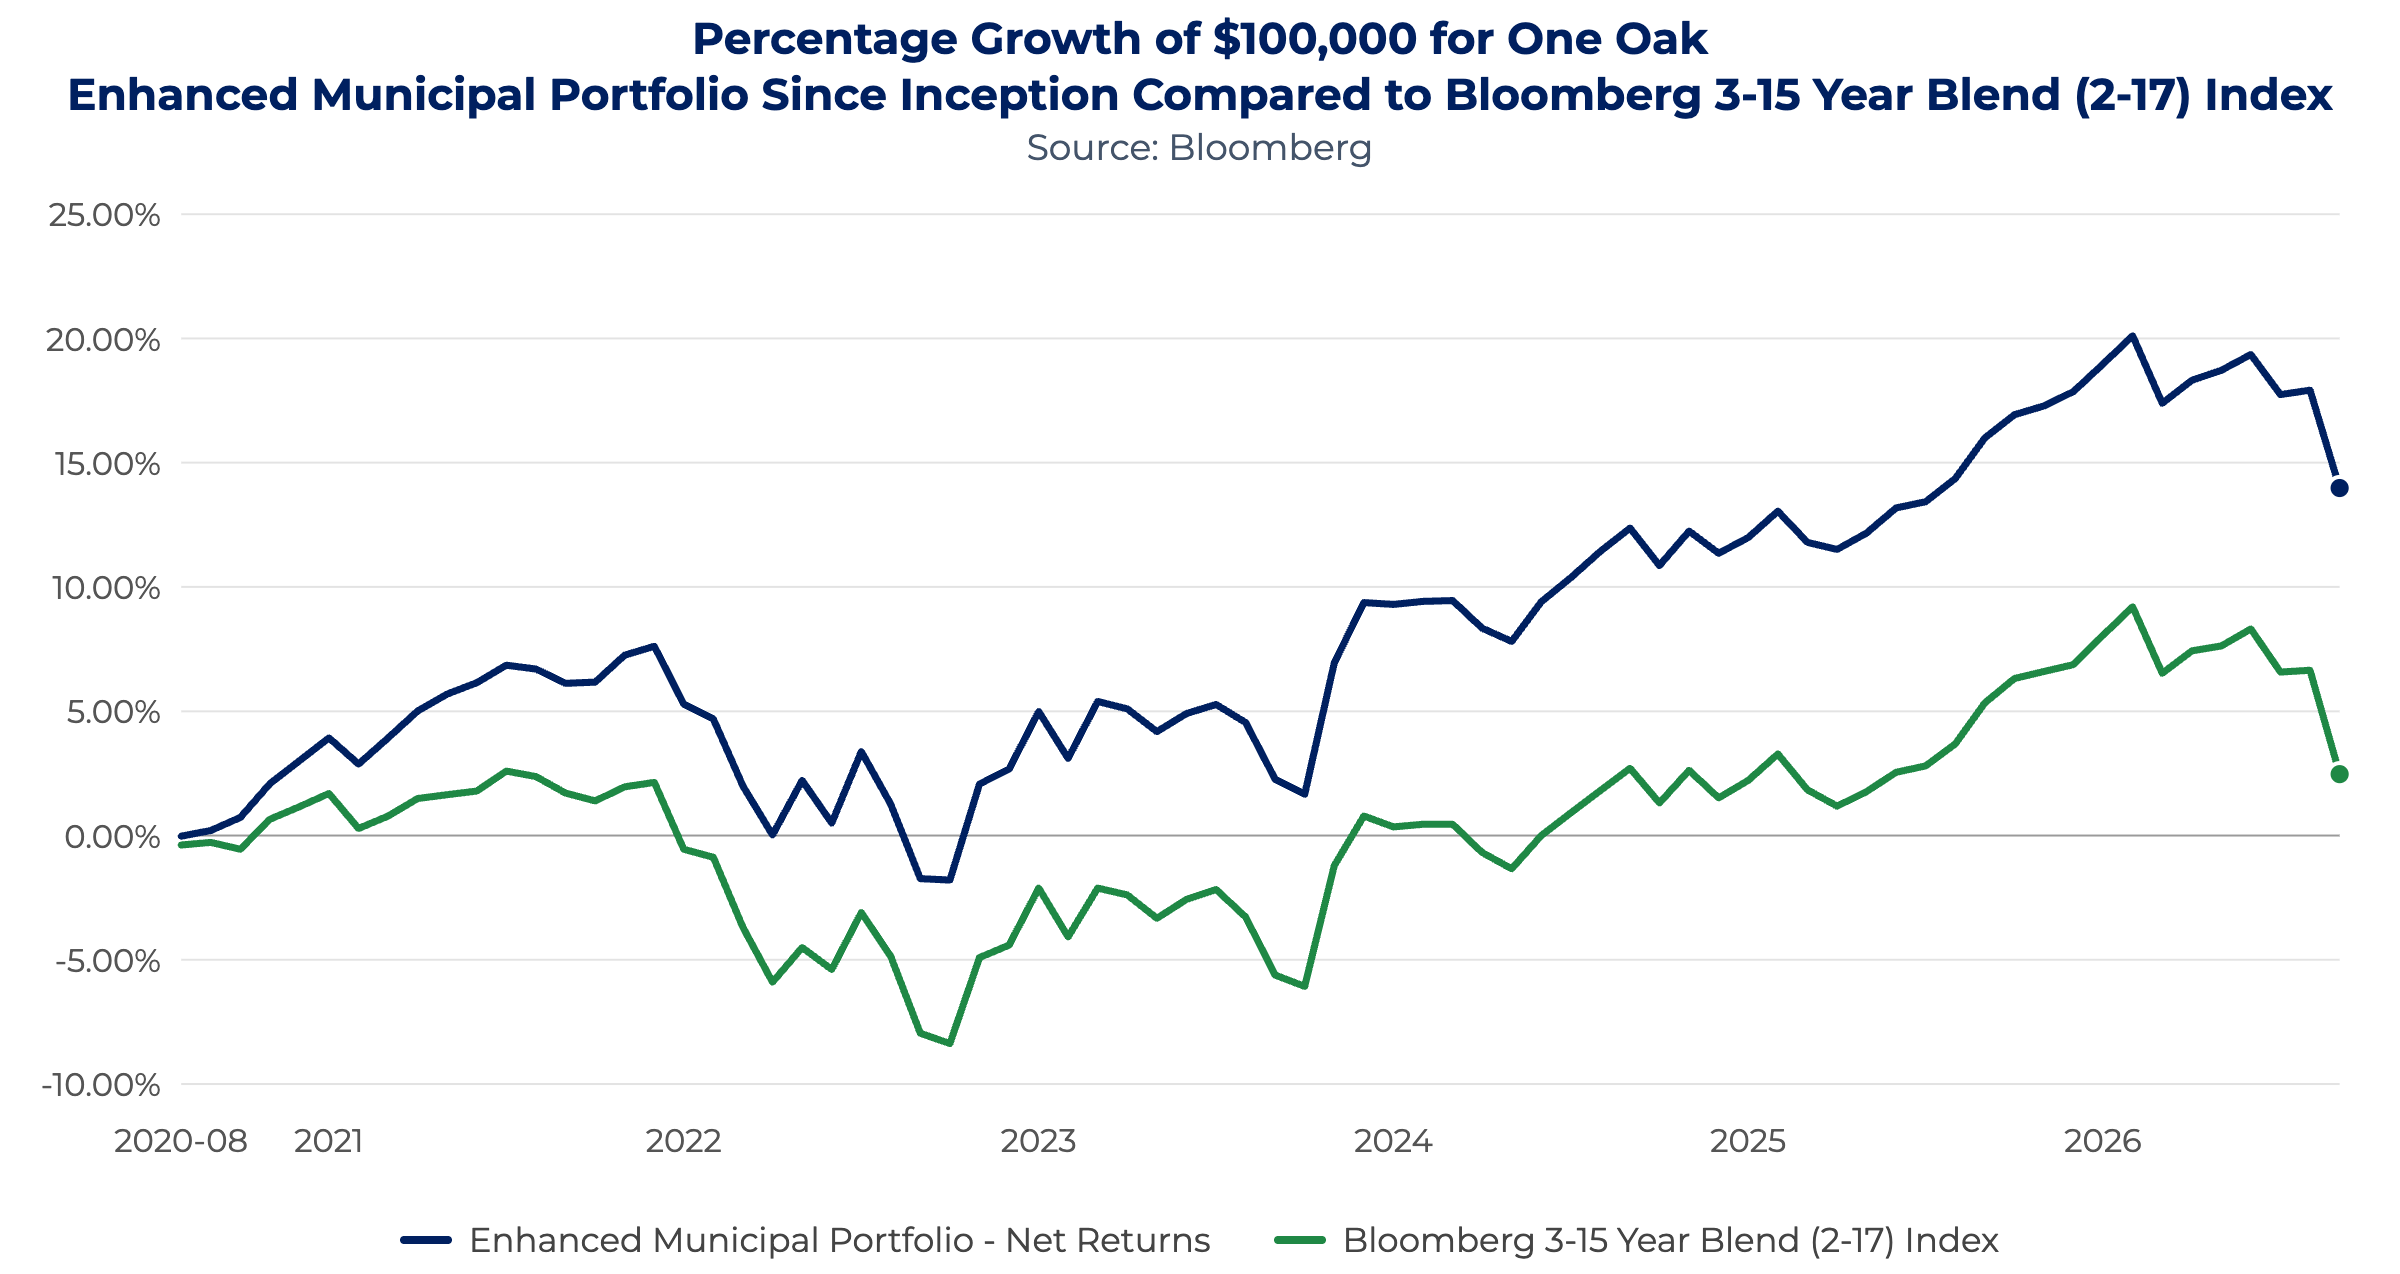
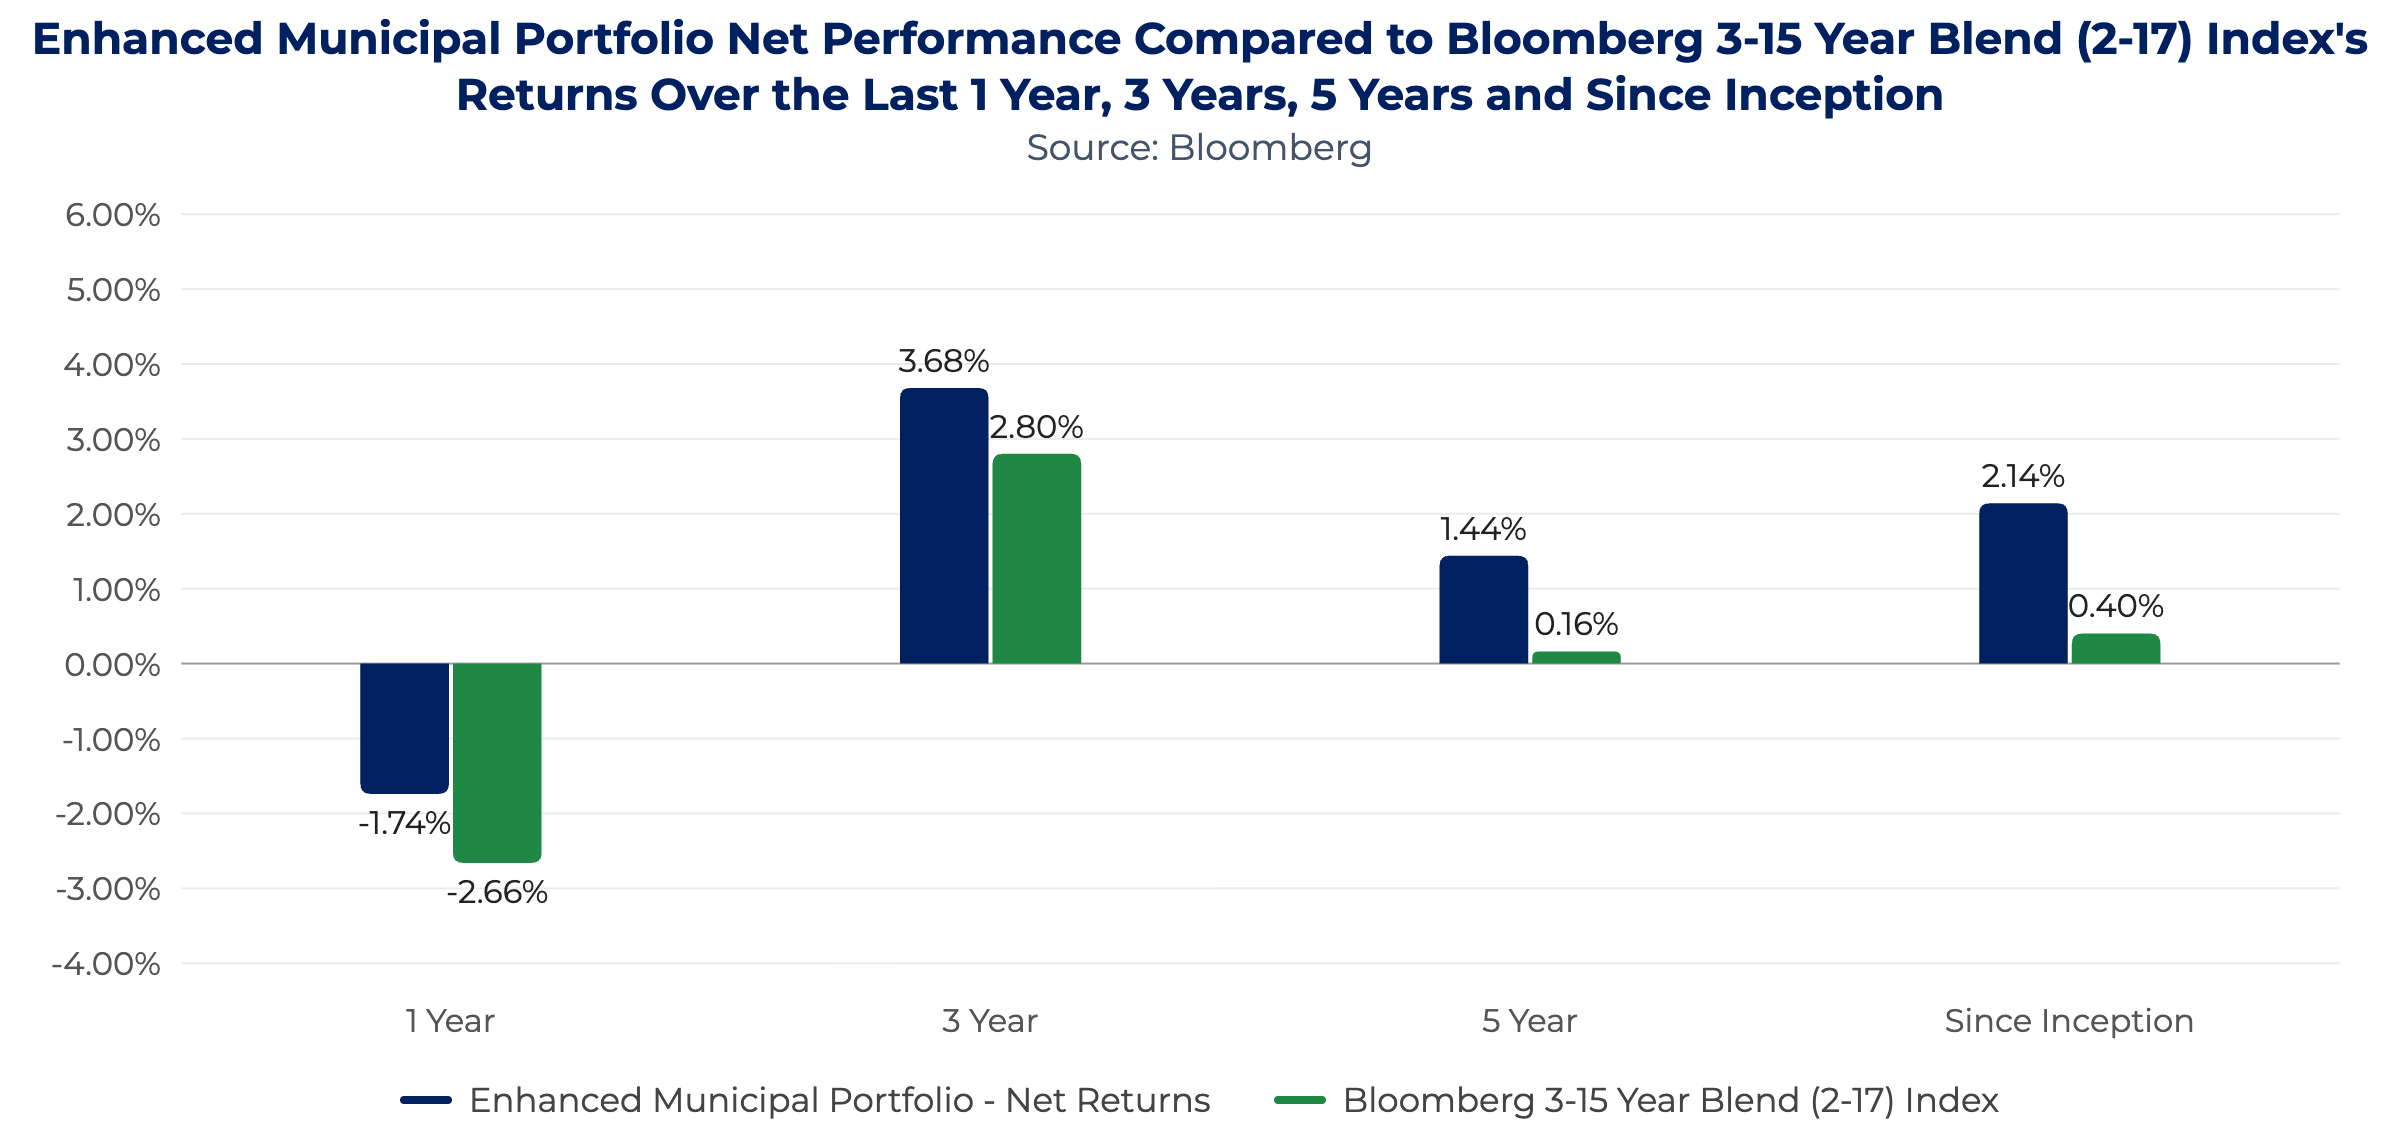
For the third quarter, the One Oak Enhanced Municipal Portfolio (Tax Advantaged) returned -4.50% (net of fees), compared with -5.40% for the Bloomberg 3-15 Year Blend (2-17) Total Return Index.
September brought a severe storm to the tax-exempt municipal market, but the repricing materially improved the income and relative value available at quarter-end. On September 30, the 10-year AAA municipal yield was 4.11%, and the 30-year AAA yield was 5.19%; the 15-year AA revenue yield was 5.02%, and A-rated revenue yields exceeded 5% beginning at roughly 13 years. The 10-year municipal-to-Treasury ratio ended near 78% and the 30-year ratio near 92%, both materially higher than the rich levels that prevailed earlier in 2026. Higher starting yields mean that income can contribute more to prospective returns without requiring rapid Fed easing or a large Treasury rally.
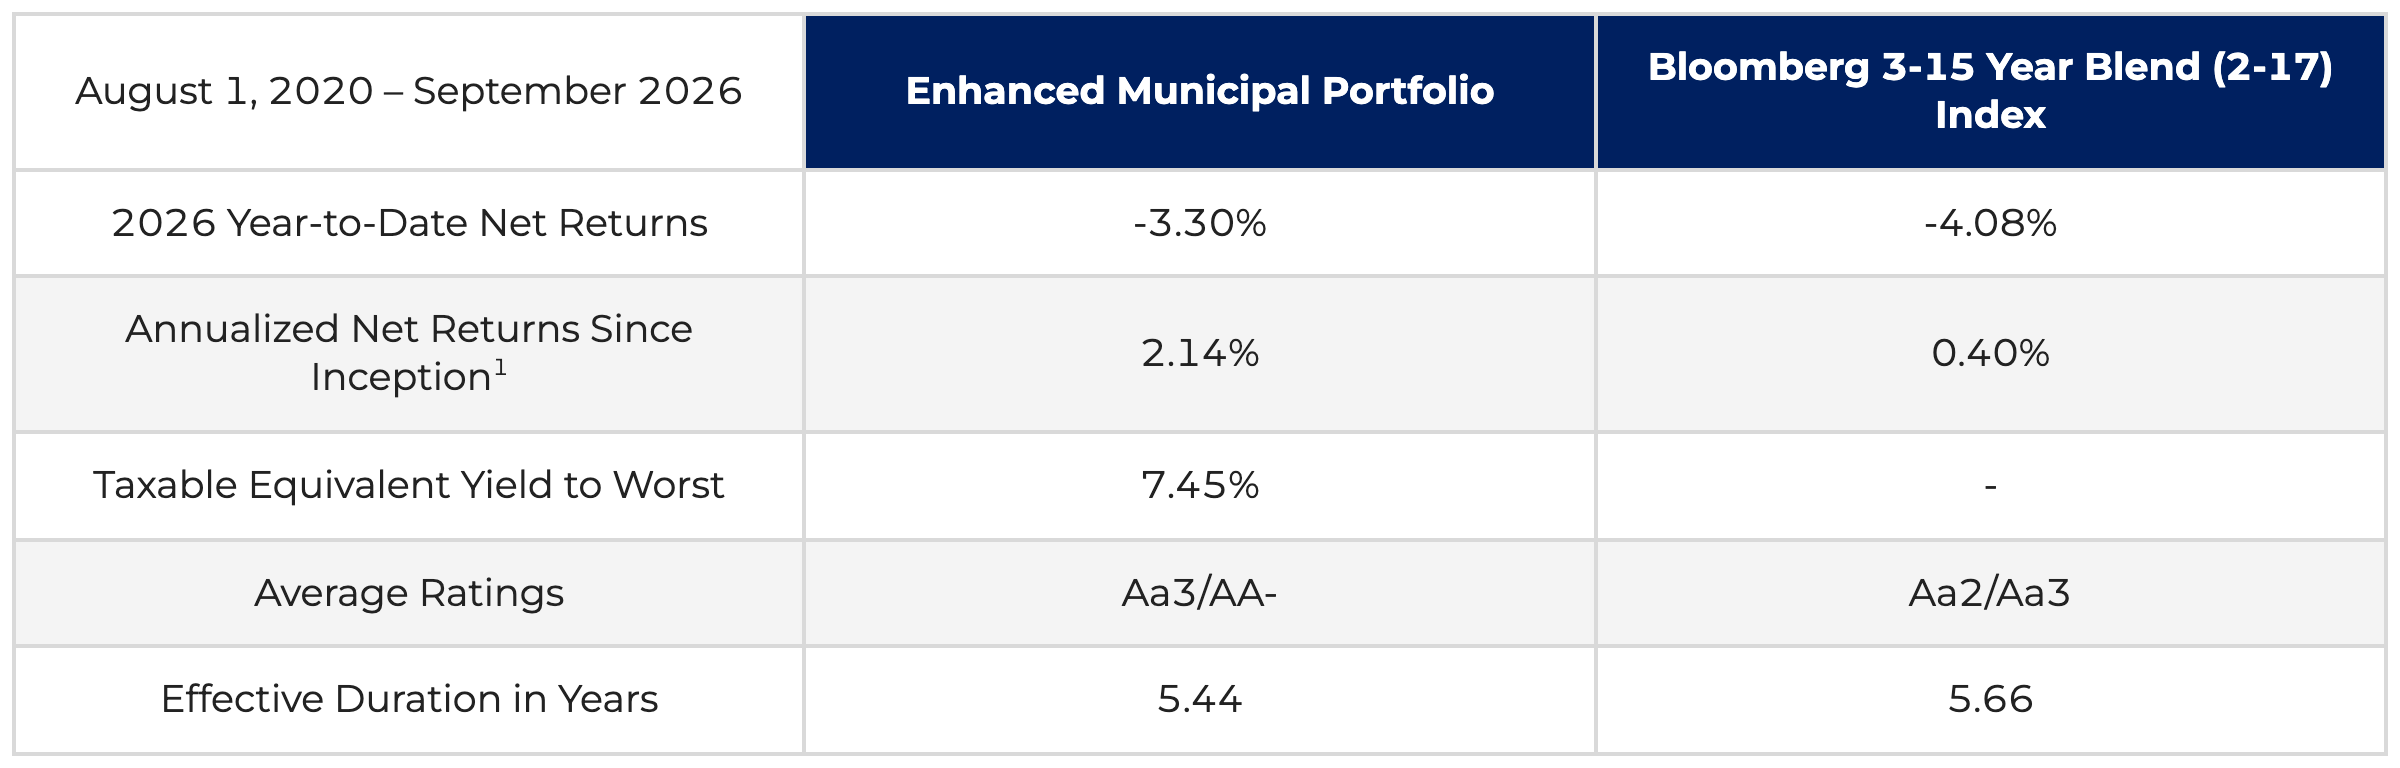
1 Inception date is August 1, 2020
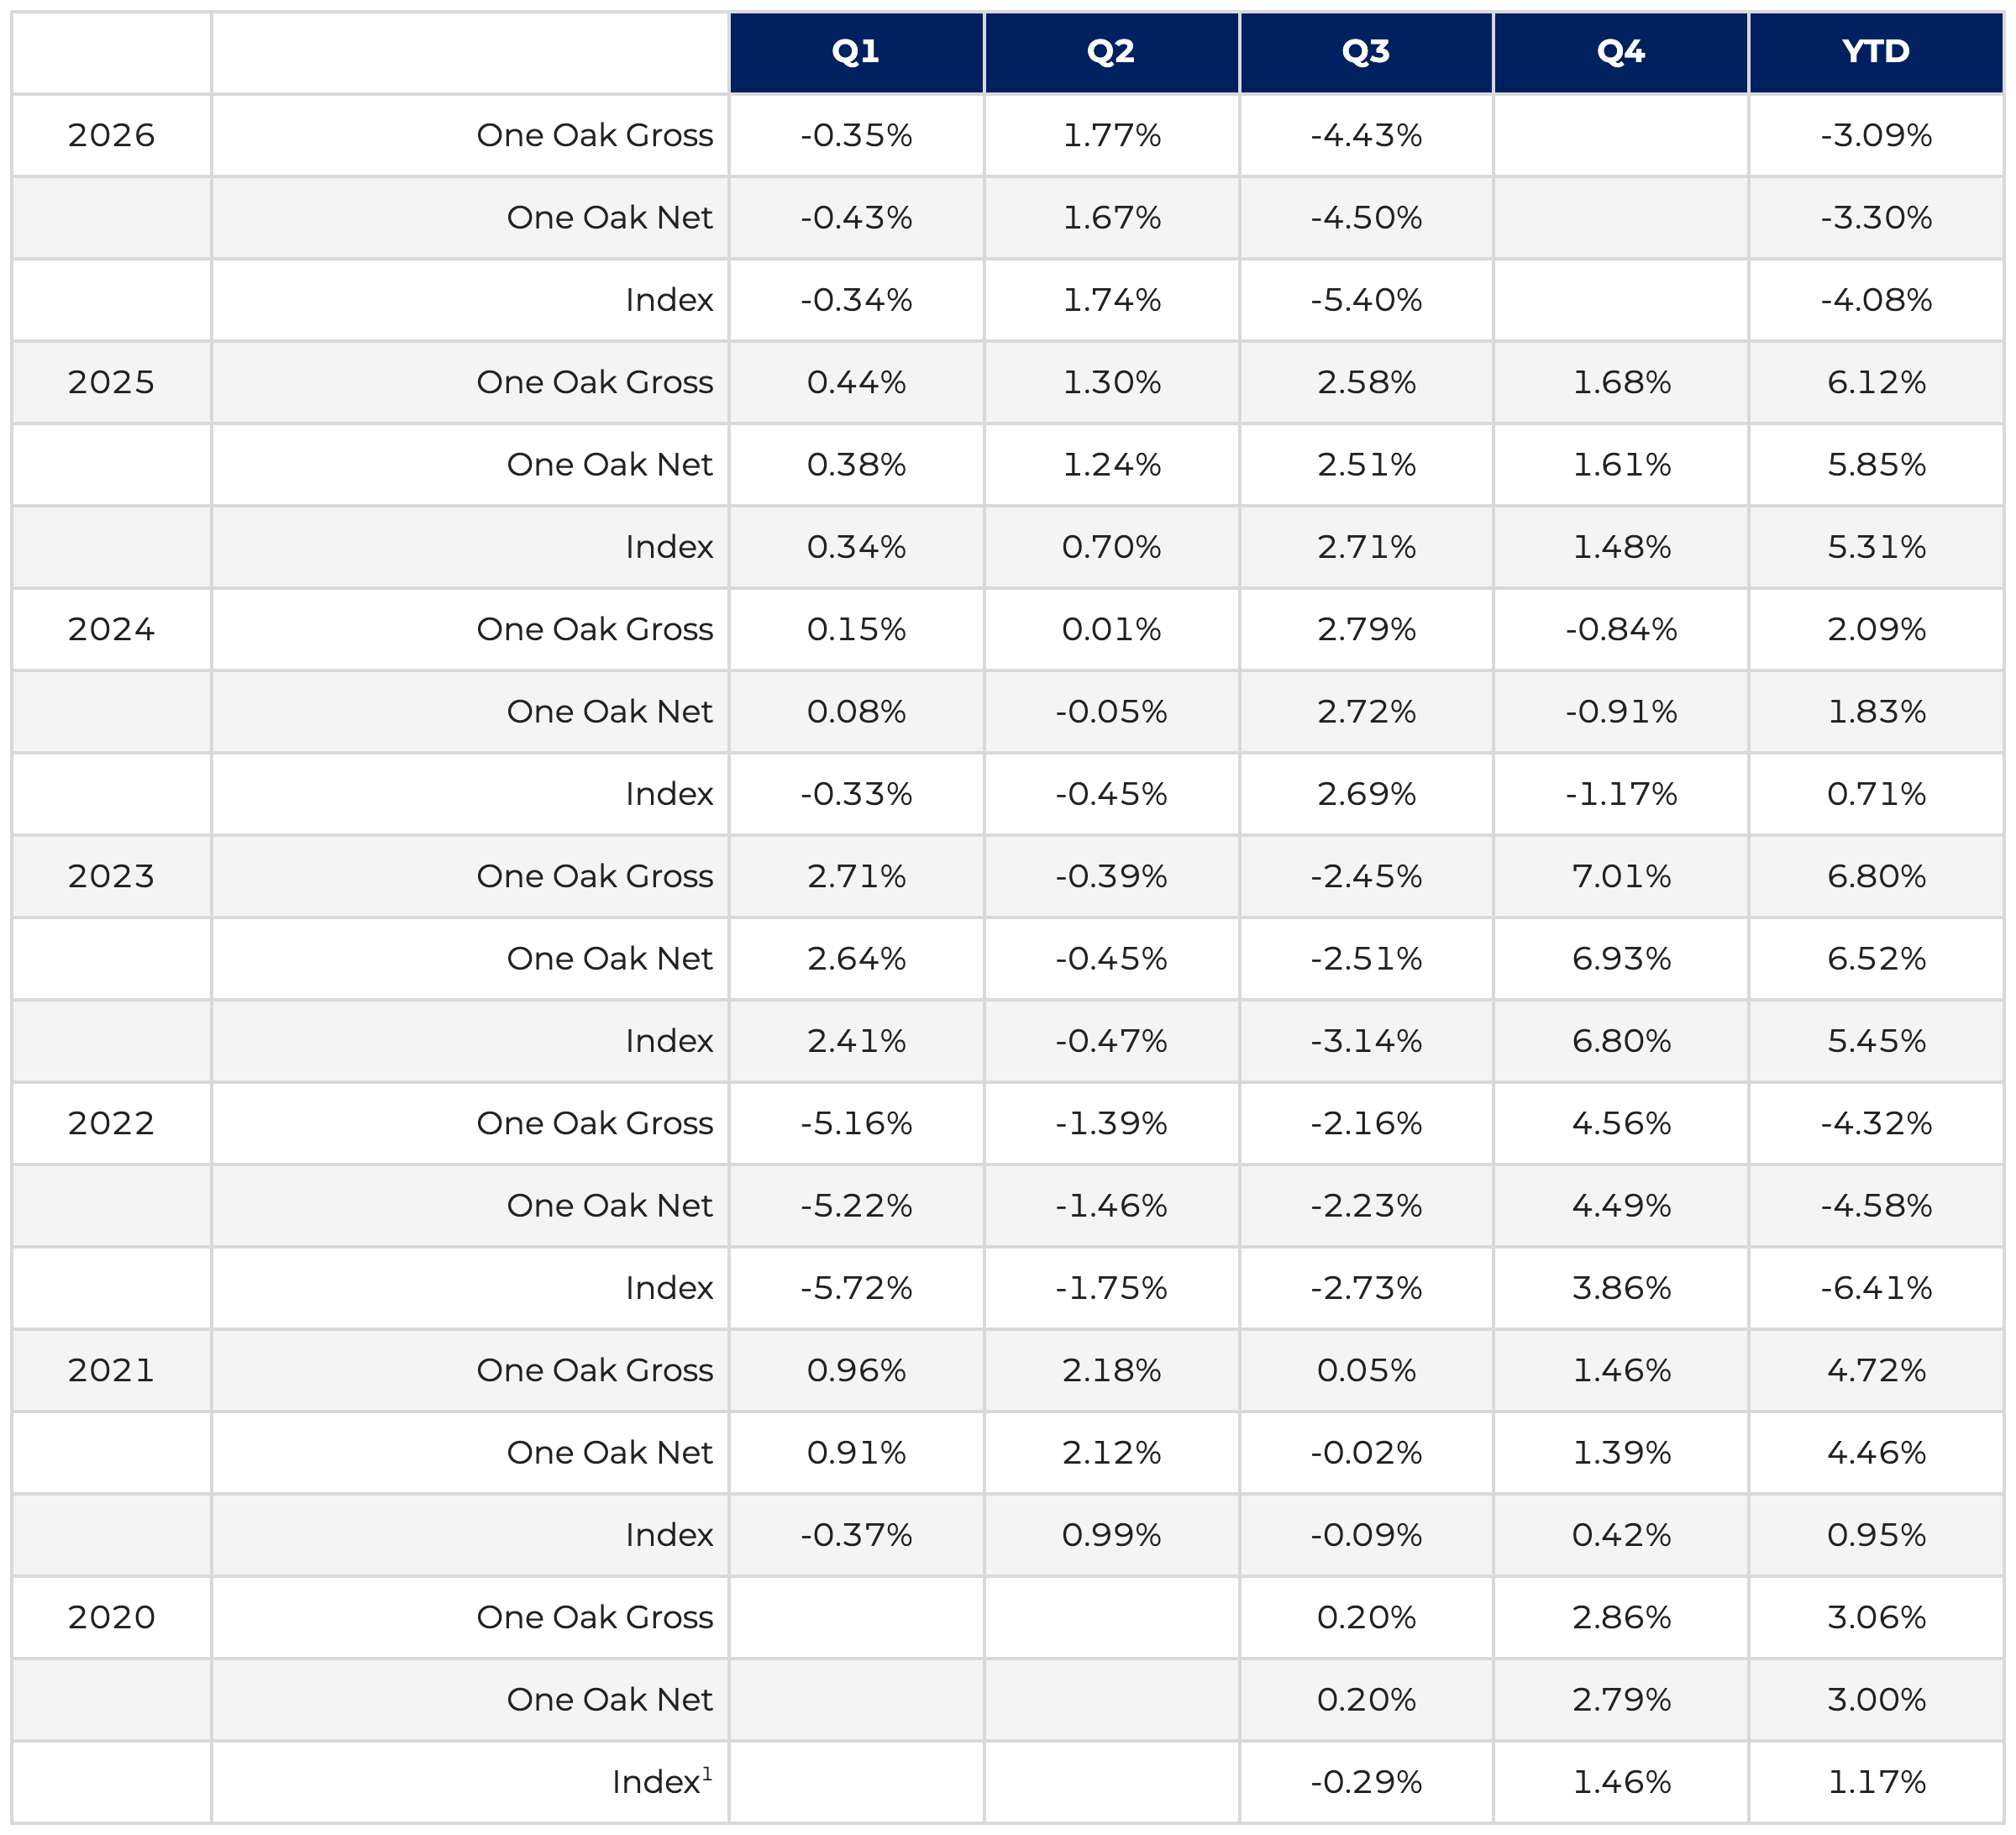
Past performance is no guarantee of future results.
1 Source: Bloomberg 3-15 Year Blend (2-17) Index
TREASURY MARKET - Treasury yields rose sharply during Q3 as persistent inflation, higher energy prices, stronger-than-previously-reported economic growth, heavy federal borrowing and extraordinary corporate financing needs competed for investor capital. From June 30 through September 30, the Treasury yield changes were +74 basis points in 2 years, +90 basis points in 5 years, +85 basis points in 10 years and +73 basis points in 30 years. The 10-year ended the quarter at 5.29% and the 30-year at 5.64%.
Monthly Performance - July began the upward-rate move, August was comparatively calm and September produced the decisive repricing. The September Treasury yield changes were +54 basis points in 2 years, +60 basis points in 5 years, +54 basis points in 10 years and +39 basis points in 30 years.
Federal Reserve and Domestic Economic Data - The Federal Reserve raised the federal-funds target range by +25 basis points on September 16 to 3.75%-4.00%. The August PCE report released September 30 showed headline inflation of 3.4% year over year and core inflation of 3.0%, with the core reading below expectations. Revised Commerce Department data also raised annualized real GDP growth to 2.5% in Q1 and 2.2% in Q2. The combination of firmer growth and still-elevated inflation leaves the Q4 rate path uncertain.
Issuance and the Competition for Capital - The U.S. Government borrowed roughly $739 billion during Q3 and expects to borrow another approximately $628 billion in Q4, while corporations issued nearly $500 billion of investment-grade debt during the quarter. That competition for capital contributed to higher clearing yields across fixed income and remains an important source of rate volatility.
TAX-EXEMPT MUNICIPAL BOND MARKET - The Q3 municipal selloff was severe, but the evidence continues to point to a rates-and-technicals event rather than a generalized high-grade credit event. During September 5-, 10- and 30-year AAA municipal yield changes were approximately +91, +83 and +65 basis points, respectively. Credit spreads were much more stable than prices for most of the quarter, while absolute yields and municipal-to-Treasury ratios improved sharply by September 30.
Monthly Performance - The Bloomberg Municipal Bond 3-17 Index returned -1.61% in July, +0.08% in August and -3.93% in September. Compounding the three months produced a Q3 return of approximately -5.4%. September accounted for most of the quarter's decline, and the damage increased with maturity.
Issuance and Notable Transactions - Tax-exempt issuance reached roughly $58 billion in August, the largest August on record, and September municipal issuance was approximately $56 billion, the largest September in data going back to 2010. Year-to-date municipal issuance approached $468 billion by quarter-end, about 9% ahead of the prior year's record-setting pace. By late September, volatility forced larger concessions and caused some transactions to be postponed or moved to day-to-day status.
Interest Rates, Credit Spreads and Relative Value - Q3 sharply separated rate risk from credit risk. Investment-grade municipal spreads changed by -7 basis points in July to 87 basis points and by another -2 basis points in August to 85 basis points even as benchmark yields rose. Much of the late September widening occurred amid weak liquidity and forced selling. On September 30, the 10-year municipal-to-Treasury ratio was roughly 78% and the 30-year ratio roughly 92%, materially improving relative value from earlier in the year.
Secondary Trading and Fund Flows - Late September trading conditions created unusually wide price dispersion. Bid-wanted volume reached record or near-record levels, many bonds cleared below prior evaluations, open-ended funds experienced outflows and ETFs continued to attract money. The combination accelerated price discovery across the market.
Credit Conditions and Q4 Outlook - High-grade municipal fundamentals remained broadly sound. Q4 still begins with rate risk from inflation, Fed policy, energy prices and heavy Treasury borrowing, but the September repricing left tax-exempt yields materially higher and relative value materially better than earlier in 2026. The investment case therefore relies less on a specific near-term rate outcome and more on the income available at current yield levels.
SMA Category: Investment Grade Taxable Municipals and Investment Grade Corporates

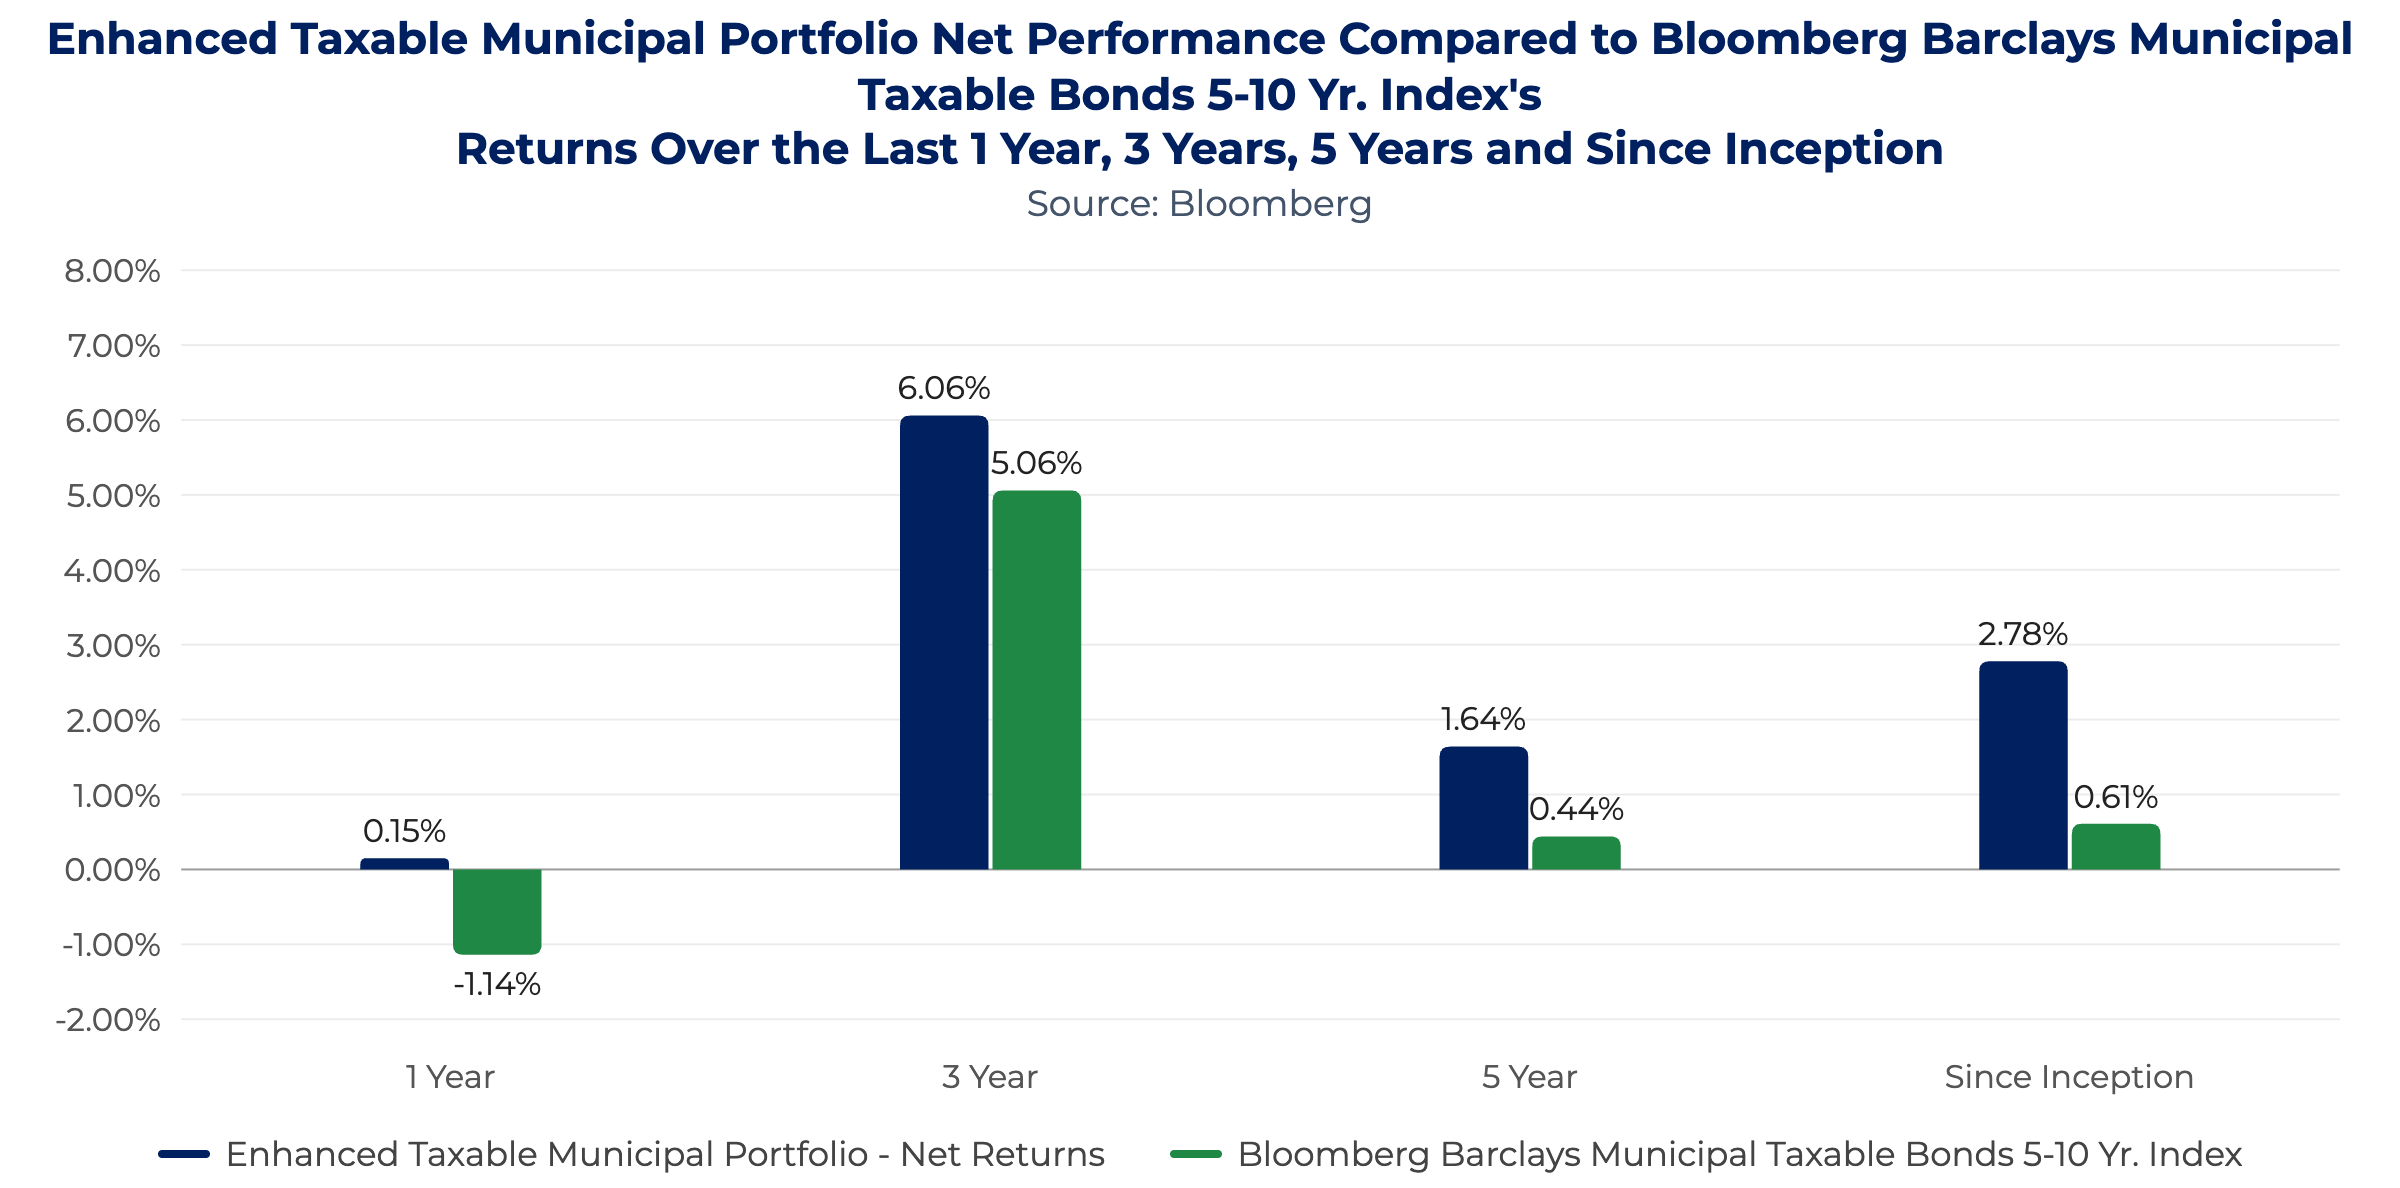
One Oak Enhanced Taxable Municipal Portfolio received a Zephyr’s PSN Top Gun award for having a Top 10 return for the three-year ending June 30, 2026, in the PSN Municipal Universe. The One Oak Enhanced Taxable Municipal Portfolio ranked eighth out of 94 Firms and 210 Products.
One Oak Enhanced Taxable Municipal Portfolio received a Zephyr’s PSN Top Gun award for having a Top 10 return for the three-year ending June 30, 2026, in the PSN Intermediate Maturity Universe. The Enhanced Taxable Municipal Portfolio also had a R-Squared of 0.80 or greater compared to the relative benchmark for the recent five-year period and a return greater than the style benchmark for the three latest three-year rolling returns. The One Oak Enhanced Taxable Municipal Portfolio ranked third out of 208 Firms and 570 Products.

1 Inception date is August 1, 2020 (inception to date returns are annualized)
2 Source: Bloomberg Barclays Municipal Taxable Bonds 5-10 Yr. Index

2 Source: Bloomberg Barclays Municipal Taxable Bonds 5-10 Yr. Index
Disclaimer: References made to awards/rankings are not an endorsement by any third party to invest in One Oak and are not indicative of future performance. Investors should not rely on awards/rankings for any purpose and should conduct their own review prior to investing. Zephyr/PSN is an asset and wealth management software marketed by Informa (LSE: INF). PSN is a database of Separately Managed Accounts managed by Zephyr. One Oak does not compensate Zephyr for inclusion in the PSN database, nor does it compensate Zephyr for consideration for, or awarding of, the PSN Top Gun designation. The Morningstar Rating for Funds, often called the Star Rating, is a data-driven rating that measures the past performance of a fund in comparison to peers. One Oak has purchased the Morningstar Basics Package, which grants One Oak permission to feature its Morningstar Rating in marketing materials. This purchase, renewed on an annual basis, has a value of $6,885.06.
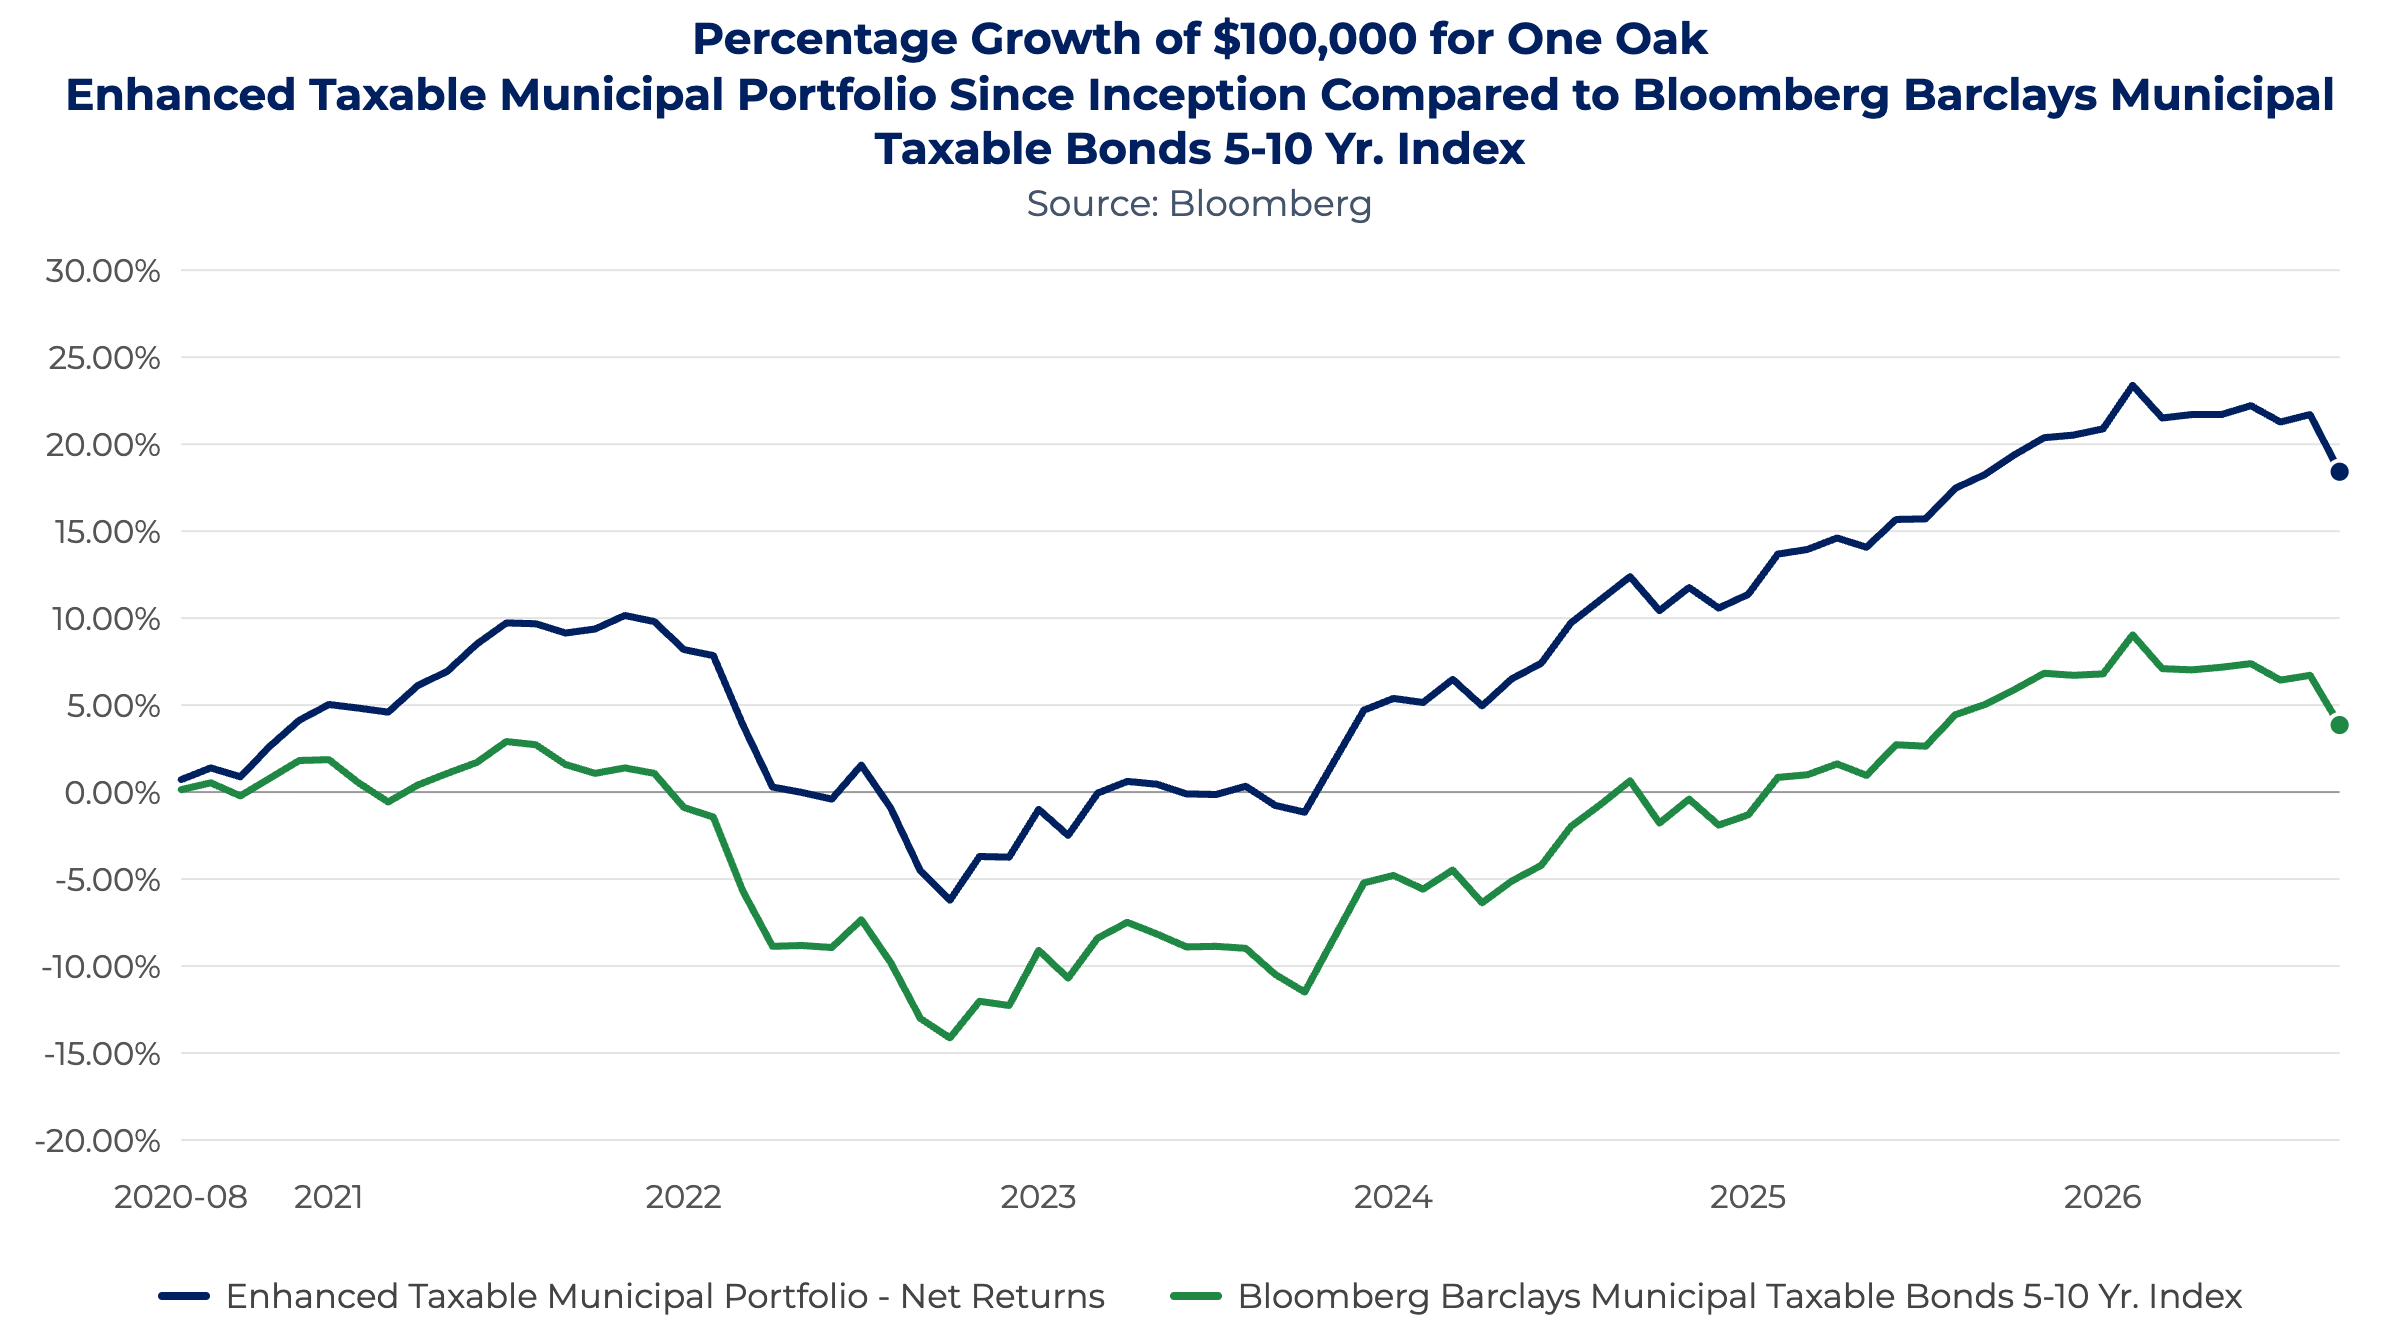
For the third quarter, the One Oak Enhanced Taxable Municipal Portfolio returned -3.07% (net of fees), compared with -3.28% for the Bloomberg Municipal Taxable Bonds 5-10 Year Index.
September's bond-market storm also hit taxable municipals and investment-grade corporates, but quarter-end yields were materially higher in both sectors. On September 25, the broad taxable municipal index yielded approximately 5.73% with spreads near 52 basis points. Investment-grade corporate yields also moved sharply higher during the quarter. The principal Q3 driver was the Treasury repricing rather than widespread deterioration in high-grade credit.
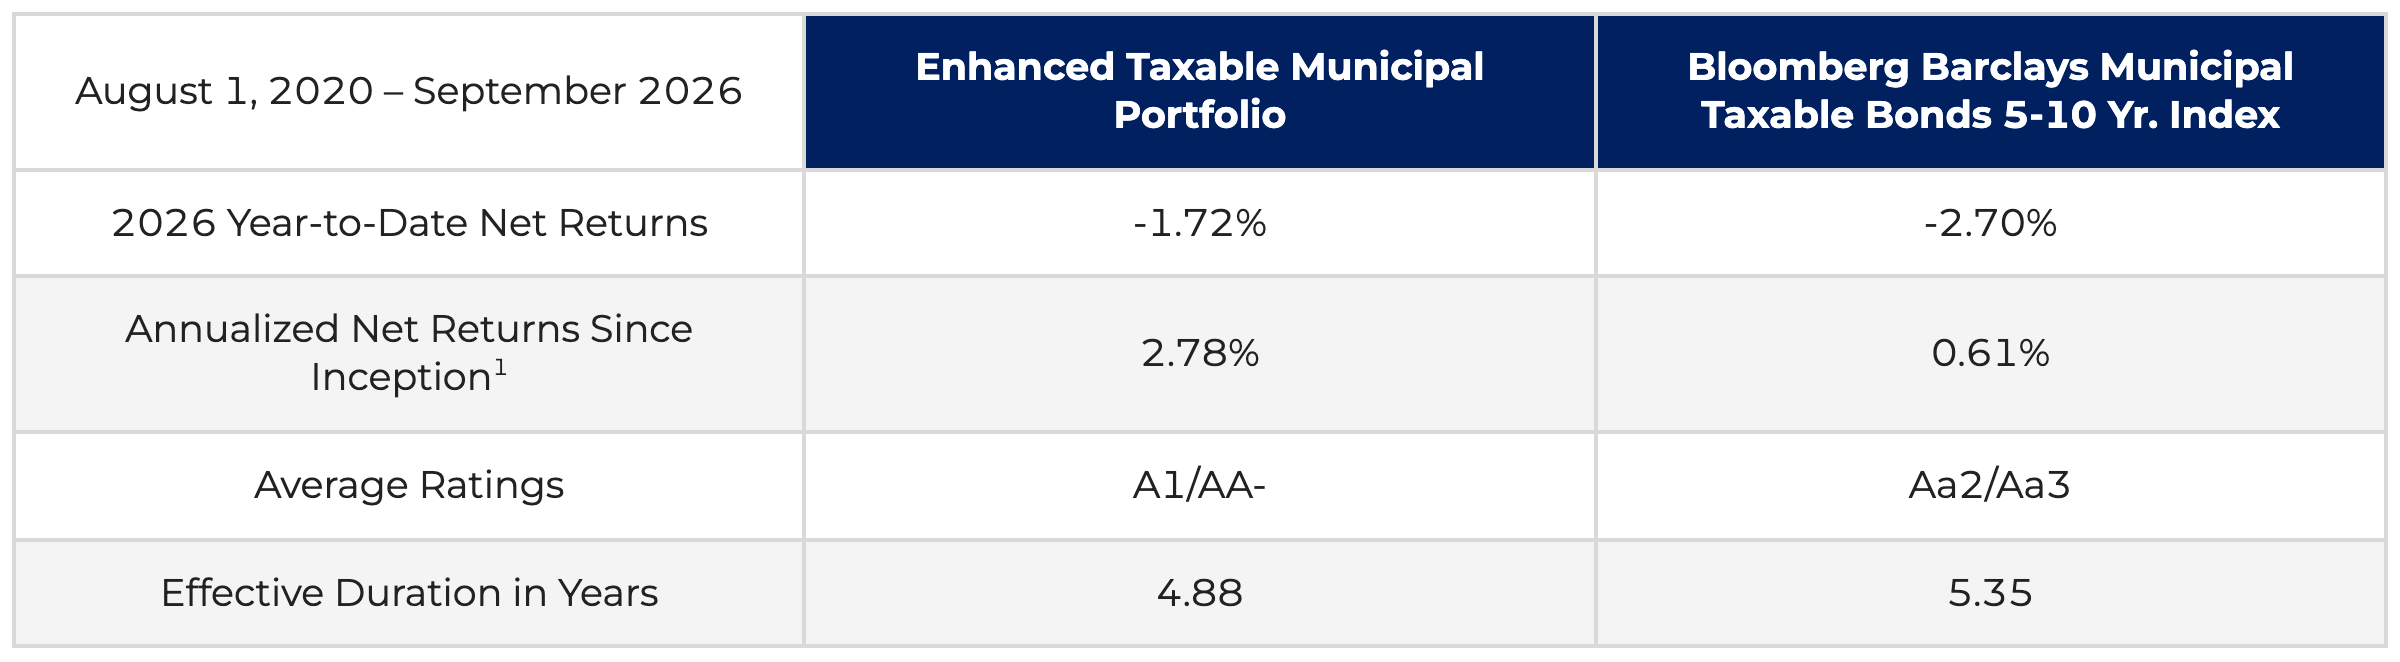
1 Inception date is August 1, 2020
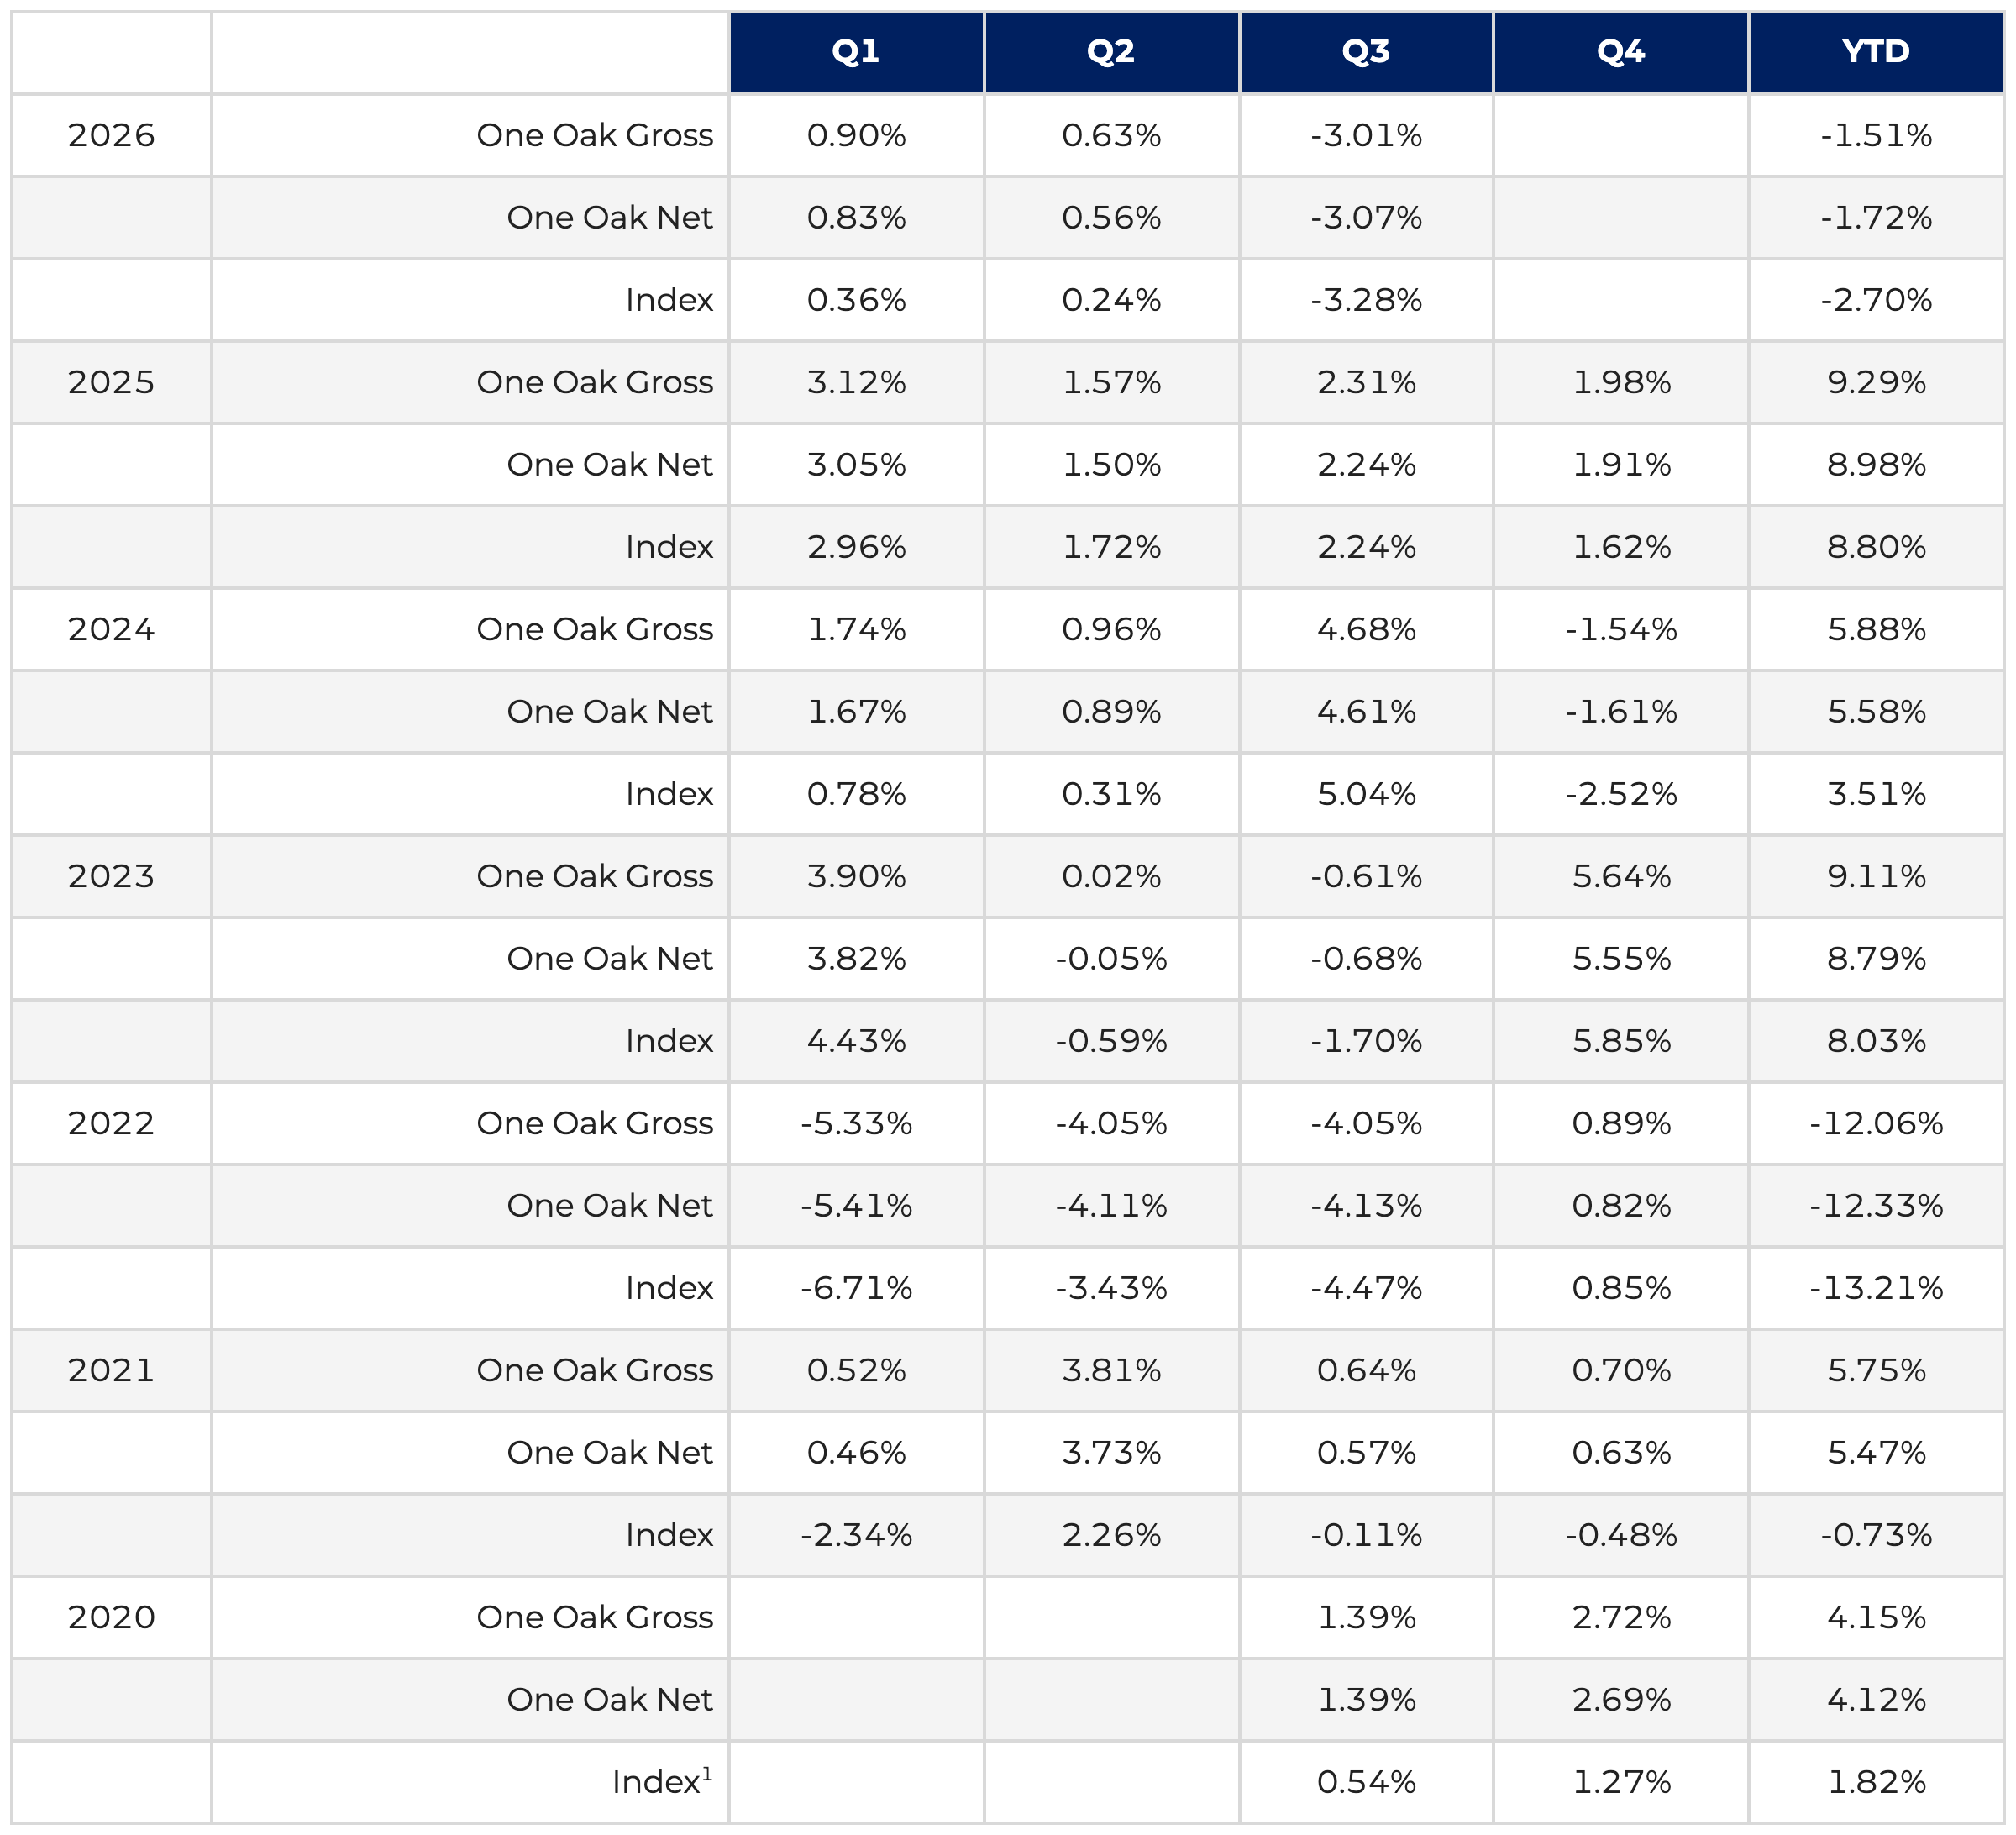
Past performance is no guarantee of future results.
1 Source: Bloomberg Barclays Municipal Taxable Bonds 5-10 Yr. Index
TREASURY MARKET - The Treasury curve repriced sharply during Q3 as persistent inflation, higher energy prices, stronger economic growth, heavy federal borrowing and expanding corporate financing needs competed for capital. From June 30 through September 30, Treasury yield changes were +74 basis points in 2 years, +90 basis points in 5 years, +85 basis points in 10 years and +73 basis points in 30 years. The 10-year ended at 5.29% and the 30-year period at 5.64%.
Monthly Performance - July began with the selloff, August provided a brief period of stability and September produced the decisive repricing. The magnitude of the Treasury move was much larger than the change in high-grade credit spreads, so longer-duration taxable bonds experienced the greatest price pressure.
Federal Reserve and Domestic Economic Data - The Federal Reserve raised the federal-funds target range by +25 basis points on September 16 to 3.75%-4.00%. The August PCE report released September 30 showed headline inflation of 3.4% year over year and core inflation of 3.0%, while revised GDP data showed annualized real growth of 2.5% in Q1 and 2.2% in Q2. The result is a Q4 rate outlook with meaningful uncertainty rather than a clear one-way path.
Issuance and the Competition for Capital - The U.S. Government borrowed roughly $739 billion during Q3 and expects to borrow another approximately $628 billion in Q4. Corporations issued nearly $500 billion of investment-grade debt during the quarter, while AI- and data-center-related financing became an increasingly important source of borrowing. That additional supply increased competition for fixed-income capital.
TAXABLE MUNICIPAL BOND MARKET - Taxable municipals were pressured principally by the Treasury selloff rather than by widespread credit deterioration. The sector's longer duration increased rate sensitivity, while taxable issuance remained scarce relative to the 2020-2021 refunding period. On September 25, the broad taxable municipal index yielded approximately 5.73% with spreads near 52 basis points.
Issuance - Taxable issuance remained a small fraction of the municipal calendar. August taxable issuance was approximately $3 billion compared with roughly $56 billion of tax-exempt issuance, continuing the structural scarcity that has characterized the taxable municipal market since the 2020-2021 refunding boom.
Interest Rates, Curve and Credit Spreads - The Bloomberg Taxable Municipal 5-10y Index returned -.89% in July and +.26% in August. September then brought another rates-driven decline finishing at -2.66%. For Q3 the index lost -3.28%.
Credit Conditions and Q4 Outlook - Investment-grade taxable municipal fundamentals remained generally stable. The principal Q3 challenge was benchmark-rate duration, not credit deterioration. Q4 begins with materially higher all-in yields and limited taxable supply, while Treasury volatility remains the primary source of mark-to-market risk.
INVESTMENT GRADE CORPORATE BOND MARKET - Investment-grade corporates were also hurt primarily by the Treasury repricing rather than a broad credit event. Spreads moved only modestly wider while yields rose sharply, and extraordinary issuance - including substantial AI- and data-center-related borrowing - increased competition for fixed-income capital.
Issuance and Notable Transactions - Corporate issuance totaled roughly $150 billion in July, $163 billion in August and approximately $180 billion in September, taking Q3 issuance close to $500 billion and year-to-date volume above $1.8 trillion. AI-related borrowers were an increasingly important part of that calendar, adding to competition for investor capital.
Interest Rates and Credit Spreads - Investment-grade spreads moved only modestly relative to the rise in Treasury yields. The July spread change was approximately +4 basis points and the September change approximately +5 basis points. Those changes were small compared with the increase in benchmark Treasury yields, indicating that duration rather than broad credit deterioration drove most of the negative total return.
Secondary Trading - Liquidity remained strong, but buyers became more price-sensitive as Treasury, municipal and corporate yields all rose. New issues increasingly required concessions during periods of volatility.
Credit Conditions and Q4 Outlook - Investment-grade corporate fundamentals remained broadly sound. The principal Q4 risks are higher benchmark rates, extraordinary issuance and rising refinancing costs for borrowers whose low-coupon debt is maturing. Higher starting yields provide more income than earlier in 2026, but credit and duration discipline remain important.
SMA Category: Short Duration Tax-Exempt Investment Grade Municipals
Inception date is September 1, 2025
1 Source: Bloomberg Muni 1-3 Yr. Total Return Index
Past performance is no guarantee of future results.
1 Source: Bloomberg Muni 1-3 Yr. Total Return Index
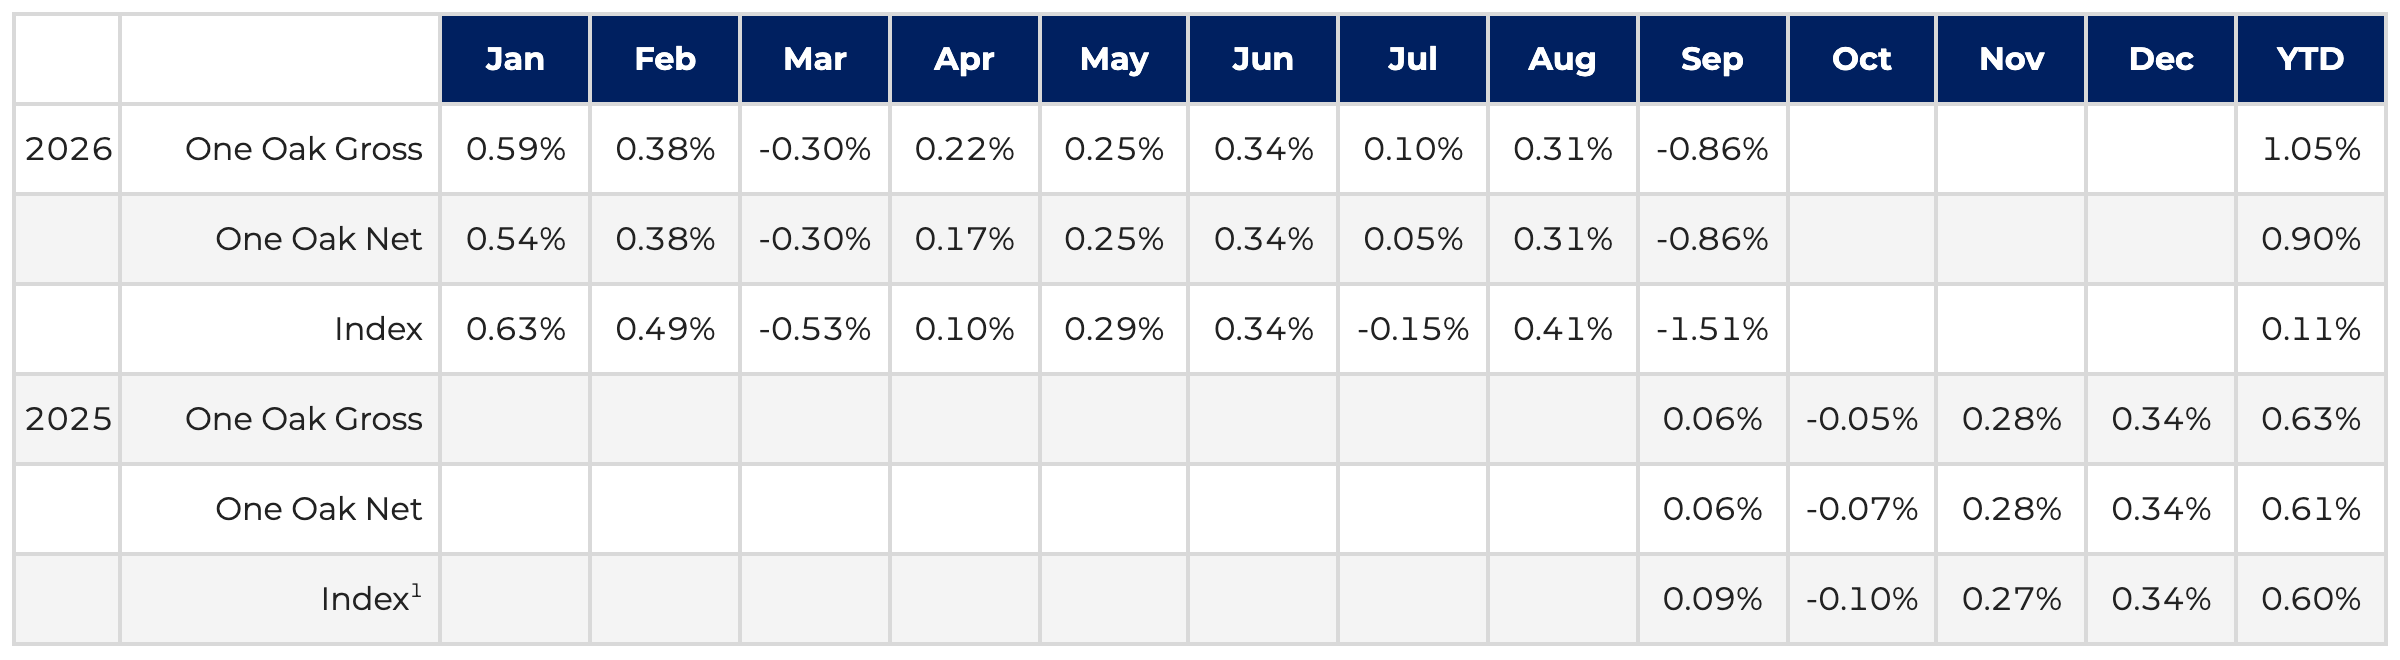
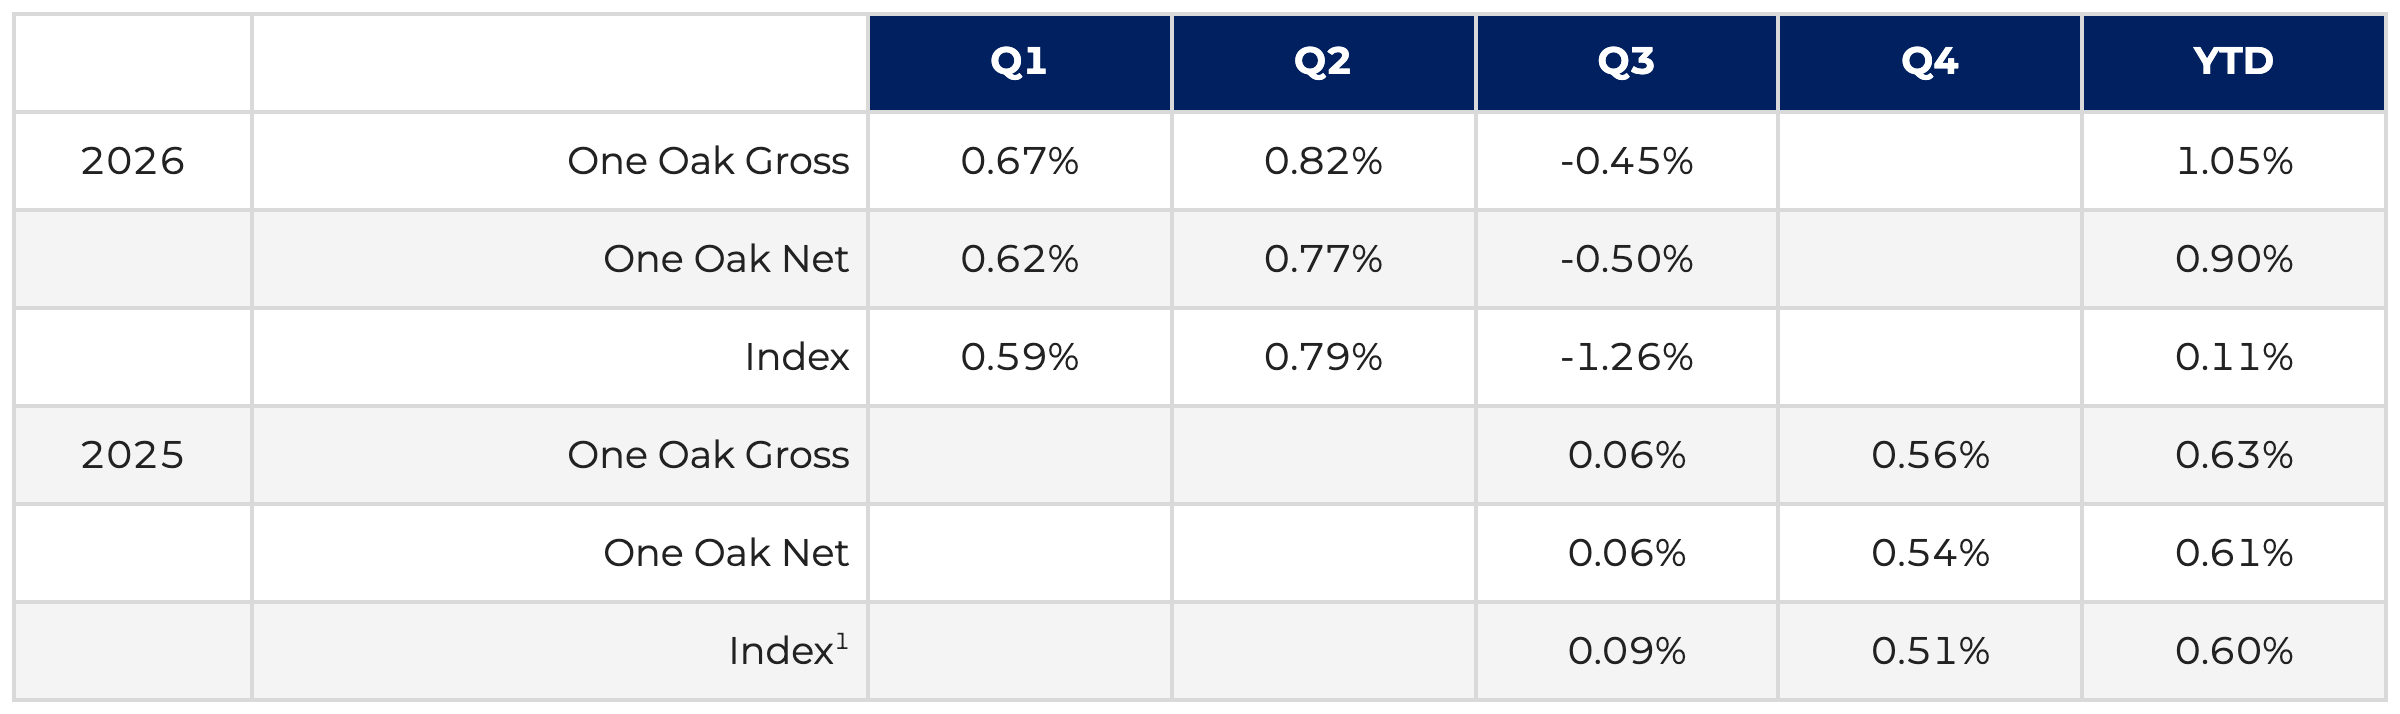
For the third quarter, the One Oak Enhanced Short Duration Municipal Portfolio returned -0.50% (net of fees), compared with -1.26% for the Bloomberg Municipal 1-3 Year Total Return Index.
September also produced substantial volatility at the front end of the municipal market. On September 30, the 2-year AAA municipal yield was 3.53%, the 3-year yield was 3.58%, and the 5-year yield was 3.71%. Assuming a 40.8% federal tax rate, those yields are approximately equivalent to taxable yields of 5.96%, 6.05% and 6.27%, respectively, before considering any state or local tax benefit. The quarter-end yield levels were materially higher than earlier in 2026.
TREASURY SHORT DURATION 1-TO-3-YEAR MARKET - From June 30 through September 30, the 2-year Treasury yield changed by +74 basis points to 4.88%, while the 5-year changed by +90 basis points to 5.09%. The front end absorbed both the September Fed hike and the market's reassessment of how long policy rates may remain restrictive.
Monthly Performance - September produced the largest part of the quarter's front-end repricing. The 2-year Treasury yield changed by +54 basis points during September and the 5-year by +60 basis points.
Federal Reserve and Domestic Economic Data - The Federal Reserve raised the federal-funds target range by +25 basis points on September 16 to 3.75%-4.00%. The August PCE report released September 30 showed headline inflation of 3.4% year over year and core inflation of 3.0%, while revised GDP data showed annualized real growth of 2.5% in Q1 and 2.2% in Q2. The front end therefore enters Q4 with uncertainty over the timing and extent of any additional Fed tightening.
Geopolitics and Other Market Events - The Iran conflict affected short rates through energy prices and inflation expectations. Late-quarter improvement in tanker traffic through the Strait of Hormuz temporarily eased some of those pressures, but energy remains an important source of inflation and rate volatility entering Q4.
Issuance and Secondary Trading - The U.S. Government expects to borrow roughly $628 billion in Q4 after about $739 billion in Q3. Heavy Treasury supply remains an important factor for front-end rates and market volatility.
SHORT DURATION TAX-EXEMPT MUNICIPAL BOND MARKET - The short municipal market repriced sharply in September. The 2-, 3- and 5-year AAA yields finished the quarter at 3.53%, 3.58% and 3.71%, respectively. Assuming a 40.8% federal tax rate, those yields correspond to taxable-equivalent yields of approximately 5.96%, 6.05% and 6.27%, respectively, before any state or local tax benefit. High-grade municipal credit fundamentals remained broadly sound.
Federal Reserve, Rates and Relative Value - Short municipal yields remain closely linked to the Fed path. At September 30 yield levels, the higher tax-exempt income available at the front end does not depend on an immediate rate cut. The tax-equivalent comparisons in this letter assume a 40.8% federal tax rate and do not include any state or local tax benefit.
Issuance - September municipal issuance was approximately $56 billion, the largest September in data going back to 2010, and year-to-date municipal issuance approached $468 billion by quarter-end. Heavy supply contributed to the market repricing and remains relevant to reinvestment conditions entering Q4.
Secondary Trading, Credit Conditions and Q4 Outlook - Late-September volatility generated heavy trading and tax-loss-related selling, while high-grade municipal fundamentals remained broadly sound. Q4 begins with higher short tax-exempt yields than earlier in the year, but additional Fed tightening, heavy Treasury borrowing and energy-driven inflation remain important risks. The shorter maturity profile reduces interest-rate sensitivity relative to intermediate and long municipals, but it does not eliminate price volatility.
Until next time,
Stephen DiTursi, CEO, CIO
(914) 205-5821
sditursi@oneoakcapitalmgmt.com
Disclosures
One Oak Capital Management is an SEC-registered investment adviser and manager of separately managed portfolios. Registration as an investment adviser does not imply a level of skill or training. This presentation is not an offer to sell, or the solicitation of an offer to purchase, any investment managed or sponsored by One Oak Capital Management or any of its affiliated entities (collectively, “One Oak”). The index shown is provided for illustrative purposes only, is unmanaged, reflects the reinvestment of income and dividends, and does not reflect the impact of advisory fees. Investors cannot invest directly in an index. Comparisons to indices have limitations because indices have volatility and other material characteristics that may differ from a particular One Oak strategy. One Oak's performance may differ substantially from the performance of an index. In addition, data used in the benchmark is obtained from sources considered to be reliable, but One Oak makes no representations or guarantees about the accuracy of such data. The Enhanced Municipal Portfolio uses active management and is not benchmarked to the index. Actual performance results may differ from composite returns, depending on the size of the account, investment guidelines and/or restrictions.
The Bloomberg 3-15 Year Blend (2-17) Municipal Bond Index covers the USD-denominated tax-exempt bond market with a maturity between 2 and 17 years. It includes general obligation and revenue bonds, which both can be pre-refunded years later and get reclassified as such.
The Bloomberg Barclays Municipal Taxable Bonds 5-10 Year Index measure the performance of municipal bonds with time to maturity of more than five years and less than ten years.
The Bloomberg Municipal 1-3 Year Total Return Index Unhedged is a benchmark for the U.S. municipal bond market, specifically tracking the performance of U.S. government and corporate bonds that mature between 1 and 3 years. Past performance is not representative of future return performance. The net returns for the Enhanced Municipal Portfolio and Enhanced Taxable Portfolio are based on the gross returns reduced by the standard fee structure of a .30% management fee. The net returns for the Enhanced Short Duration Portfolio are based on the gross returns reduced by the standard fee of 0.20% management fee. The returns include the reinvestment of dividends, interest, and other earnings. The information provided was calculated by One Oak Capital Management, LLC using a combination of proprietary and external data sources and has not been audited for accuracy. Information contained herein obtained from third-party sources is believed to be reliable, but One Oak makes no representation as to its accuracy or completeness.
While interest on municipal bonds is generally exempt from federal income tax, it may be subject to the federal alternative minimum tax, or state or local taxes. Profits and losses on federally tax-exempt bonds may be subject to capital gains tax treatment. Fixed income risks include, but are not limited to, changes in interest rates, liquidity, credit quality, volatility, and duration.
Due to various risks and uncertainties, actual events, results or the actual performance of the investment may differ materially from those reflected or contemplated in the returns presented within. While assumptions underlying various statements as to the future performance are believed to be reasonable in nature, prospective investors should make their own assessments as to such assumptions and the associated risks, including the likelihood of the strategy achieving the corresponding results. All of which are subject to risks and uncertainties, many of which are beyond the control of the investment adviser. As such, no assurance is given as to the realization of any such future performance. No representation or warranty is made as to the future performance or such forward-looking statements. The delivery of this presentation does not imply that any other information contained herein is correct as of any time after the presentation date.
Actual performance results may differ from composite returns, depending on the size of the account, investment guidelines and/or restrictions, inception date, and other factors. Certain information contained in this presentation constitutes “forward-looking statements” that are inherently unreliable and actual events or results may differ materially from those reflected or contemplated herein. One Oak does not make any assurance as to the accuracy of those predictions or forward-looking statements and expressly disclaims any obligation to update or revise any such forward-looking statements. The views and opinions expressed herein are those of One Oak as of the date hereof and are subject to change based on prevailing market and economic conditions and will not be updated.
These materials contain confidential and proprietary information and have been provided with the express understanding that their distribution or the divulgence of any of their contents to any person, other than the person(s) to whom they were originally delivered and such person’s advisors, without the prior consent of One Oak is prohibited.
To invest with One Oak Capital Management LLC, you must be a qualified or accredited investor. Different share classes may have different results. Consult your individual statement.
References made to awards/rankings are not an endorsement by any third party to invest with One Oak and are not indicative of future performance. Investors should not rely on awards/rankings for any purpose and should conduct their own review prior to investing. Zephyr/PSN is an asset and wealth management software marketed by Informa (LSE: INF). PSN is a database of Separately Managed Accounts managed by Zephyr. One Oak does not compensate Zephyr for inclusion in the PSN database, nor does it compensate Zephyr for consideration for, or awarding of, the PSN Top Gun designation. The Morningstar Rating for Funds, often called the Star Rating, is a data-driven rating that measures the past performance of a fund in comparison to peers. One Oak has purchased the Morningstar Basics Package, which grants One Oak permission to feature its Morningstar Rating in marketing materials. This purchase, renewed on an annual basis, has a value of $6,885.06.
One Oak Capital Management is an SEC-registered investment adviser and manager of separately managed portfolios. Registration as an investment adviser does not imply a level of skill or training. This presentation is not an offer to sell, or the solicitation of an offer to purchase, any investment managed or sponsored by One Oak Capital Management or any of its affiliated entities (collectively, “One Oak”). The index shown is provided for illustrative purposes only, is unmanaged, reflects the reinvestment of income and dividends, and does not reflect the impact of advisory fees. Investors cannot invest directly in an index. Comparisons to indices have limitations because indices have volatility and other material characteristics that may differ from a particular OneOak strategy. One Oak's performance may differ substantially from the performance of an index. In addition, data used in the benchmark are obtained from sources considered to be reliable, but One Oak makes no representations or guarantees with regard to the accuracy of such data. The EnhancedMunicipal Portfolio uses active management and is not benchmarked to the index.
Past performance is not representative of future return performance. Net returns are calculated by deducting the highest standard fee from the gross returns on a quarterly basis. The returns reflect the net performance of employing One Oak's highest fee, 0.30% per year to the gross performance. Net returns do not include any additional intermediary fees that may be charged to the end investor. The presentation and the net performance is meant for financial professionals use only and is not intended for distribution to the end users. The returns include the reinvestment of dividends, interest, and other earnings. The information provided was calculated by One Oak Capital Management, LLC using a combination of proprietary and external data sources and has not been audited for accuracy. While interest on municipal bonds is generally exempt from federal income tax, it may be subject to the federal alternative minimum tax, or state or local taxes. Profits and losses on federally tax-exempt bonds may be subject to capital gains tax treatment. Fixed income risks include, but are not limited to, changes in interest rates, liquidity, credit quality, volatility, and duration. One Oak's management fees are deducted each quarter on the first month of the quarter: January, April, July and October. One Oak does not accrue its management fee for the remaining months and therefore the net performances for those months will be higher and does not represent the actual annual net returns.
Due to various risks and uncertainties, actual events, results or the actual performance of the investment may differ materially from those reflected or contemplated in the returns presented within. While assumptions underlying various statements as to the future performance are believed to be reasonable in nature, prospective investors should make their own assessments as to such assumptions and the associated risks, including the likelihood of the strategy achieving the corresponding results. All of which are subject to risks and uncertainties many of which are beyond the control of the investment adviser. As such, no assurance is given as to the realization of any such future performance. No representation or warranty is made as to the future performance or such forward-looking statements. The delivery of this presentation does not imply that any other information contained herein is correct as of any time subsequent to the presentation date. Actual performance results may differ from composite returns, depending on the size of the account, investment guidelines and /or restrictions, inception date, and other factors. One Oak Capital Management, LLC ("One Oak") claims compliance. with the Global Investment Performance Standards (GIPS) and has prepared and presented this report in compliance with the GIPS standards. One Oak has been independently verified for the periods 2019 through 2022.
Fees and yields are calculated by One Oak as of 07/22/25. Prospective investors are encouraged to consult a tax professional before making the decision to invest. Source: Schwab Data as of July 22, 2025. For illustrative purposes only. The framework discussed herein is hypothetical and does not represent the investment performance or the actual accounts of any investors or any funds. The results achieved in our simulations do not guarantee future investment results. It is possible that the actual results of an investor who invests in the manner these projections suggest will be better or worse than the projections, and that an investor may lose money by investing in the manner the projections suggest. The index is included for illustrative purposes only, is not available for direct investment and does not reflect the deduction of fees or expenses which would reduce returns.Actual performance results may differ from composite returns, depending on the size of the account, investment guidelines and /or restrictions, inception date, and other factorsTo invest with One Oak Capital Management LLC, you must be a qualified or accredited investor. Different share classes may have different results. Consult your individual statement.
These materials contained confidential and proprietary information and have been provided with the express understanding that their distribution or the divulgence of any of their contents to any person, other than the person(s) to whom they were originally delivered and such person’s advisors, without the prior consent of One Oak is prohibited.
To invest with One Oak Capital Management LLC, you must be a qualified or accredited investor. Different share classes may have different results. Consult your individual statement.
For more information regarding the Morningstar Rating methodology please visit www.morningstar.com/content/dam/marketing/shared/research/methodology/771945_Morningstar_Rating_for_Funds_Methodology.pdf
The PSN Municipal Universe consists of 213 strategies, across 98 firms. PSN utilizes a proprietary of our clients’ top priority performance screens. PSN Top Guns runs products in six proprietary categories in over 50 universes. This is a highly anticipated ranking and is widely used by institutional asset managers
References made to awards/rankings are not an endorsement by any third party to invest with One Oak and are not indicative of future performance. Investors should not rely on awards/rankings for any purpose and should conduct their own review prior to investing
One Oak Capital Management has done several tax-harvesting trades for the Enhanced and Enhanced Taxable Municipal Portfolio
Logos are protected trademarks of their respective owners and One Oak disclaims any association with them and any rights associated with such trademarks.


