

It was a terrific third quarter, thanks to optimism surrounding Fed rate cuts, Big Tech strength, and robust consumer spending. The S&P 500® finished up 8%, and strong performance by investment grade corporate and municipal bond markets followed.
A significant amount of market uncertainty was resolved in July. The President’s "Big Beautiful Bill" was passed, he brokered a ceasefire between Israel and Iran, and the tax-exempt status of municipal bonds was reaffirmed. However, volatility persisted throughout the month, largely due to President Trump’s shifting tariff deadlines. He announced that large tariff rates would apply to countries failing to reach a deal by the appointed deadline. Agreements were eventually reached with the EU, Japan, the Philippines, and Indonesia, among others.
August began with Treasury yields falling sharply. This was a result of softer employment figures which saw the unemployment rate tick up to 4.2% from 4.1%. Although this increase was largely attributable to the number of people looking for their first job, the market immediately pounced upon its implications. Many analysts were quick to bring their rate-cut calls forward to September, and coupled with Powell’s dovish Jackson Hole comments, Treasury prices drove higher. The S&P rose almost 2% for the month, which extended its uptrend to four consecutive months. The Bloomberg US Treasury Index gained 1.1% for the month as 10-year Treasury yields plunged 15 basis points to 4.22%.
The quarter ended with an unpleasant employment number which made the FED’s rate cut later in the month a foregone conclusion. The unemployment report showed that only 22,000 new jobs were added in August, nudging the unemployment rate up to 4.3% which left it at the highest rate since 2021. The Central Bank finally cut rates for the first time since December in response to the softening labor market. Policy makers indicated that two more rate cuts were possible this year. This left the FED funds in a range of 4%-4.25%. Intra-month strong auction demand, especially in the 10-year, also helped Treasuries to record another winning month. The Bloomberg US Treasury Index gained almost 1% while the 10-year yield fell to 4.13%. Despite the threat of a government shutdown, stocks ended the quarter in an upbeat tone with the Dow Jones closing at a record high.
The investment grade (“IG”) and high yield (“HY”) municipal markets remained resilient in Q3, leaning on favorable reinvestment figures, compelling absolute yields, and continuing inflows. The major theme for the municipal bond market for July was record issuance. Issuance during July exceeded $50 billion, which was an increase of 35% year-over-year. Year-to-date (“YTD”) issuance through June 30th was roughly 15% higher than the prior year. July’s issuance exceeded the trailing five-year average monthly issuance by 55%.
The AAA Municipal Benchmark curve steepened meaningfully during July as 5-year rates fell by 19 basis points while the 10-year and 30-year rates rose by 6 and 17 basis points. Heading into August municipal bonds continued to be well bid as approximately $55 billion of reinvestment money became available on August 1st. Fund flows were positive in three out of the four weeks of July for both IG and HY municipal mutual funds and ETFs. In July IG flows were $2.3 billion while HY flows were $0.3 billion. YTD inflows in IG were $4.5 billion and in HY were $4.7 billion.
The AAA Municipal Benchmark bull steepened in August as the 5-year maturity finished 16 basis points lower while 10 and 30-year maturities ended the month 6 basis points and 5 basis points lower, respectively. The US Treasury curve also steepened as rates were lower by 27 and 15 basis points in 5 and 10 years, while rates rose 1 basis point in 30 years. The 10-year US Treasuryyield has been range-bound for much of 2025, between about 4.2% and 4.7%.
Municipal fund complexes experienced inflows 3 out of 4 weeks in August. IG and HY funds have now experienced weekly inflows in 16 out of the last 18 weeks. Both IG and HY inflows exceeded $2 billion in August, totaling roughly $4.5 billion. Municipal supply exceeded $50 billion in August, down 7% year-over-year but remained meaningfully higher (15%) than the trailing 5-year average for the month of August.
The municipal market posted the best September performance since 2009. Manageable supply, coupled with robust demand and a supportive Fed backdrop, certainly drove the positive municipal performance this month. However, the last week of September saw the municipal market rally take a breather given the confluence of elevated supply ($14.3 billion tax-exempt), thin reinvestment capital, rising UST rates, ETF outflows, and sizable month-to-date tax-exempt bond price increases. Several new issues struggled to clear, and dealers were left with balances on both negotiated and competitive deals. Fund flows didn't help the case either as Lipper reported $145 million in outflows from IG funds, most of which were attributed to ETFs.
The taxable municipal bond market showed resilience in the third quarter of 2025, recovering from volatility that disrupted the market in the second quarter. Key factors influencing this market included yield dynamics, issuance trends, and investor sentiment.
Taxable municipal yields remained historically attractive, with an average yield of 4.99% by the end of the second quarter, matching U.S. corporate yields for the first time since 2021. After experiencing outflows earlier in the year, the market saw renewed interest from investors, driven by attractive valuations and strong fundamentals.
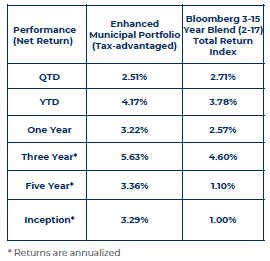
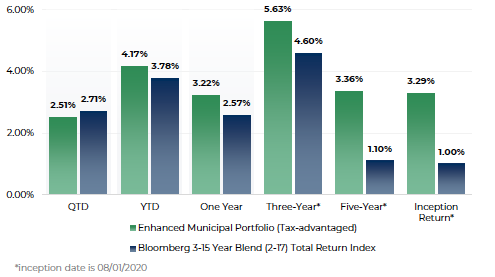
The One Oak Enhanced Municipal Portfolio, which is a laddered actively managed strategy, finished the quarter at +2.51% and the “Bloomberg 3-15 Yr Blend (2-17) Total Return Index Unhedged” returned +2.71%.
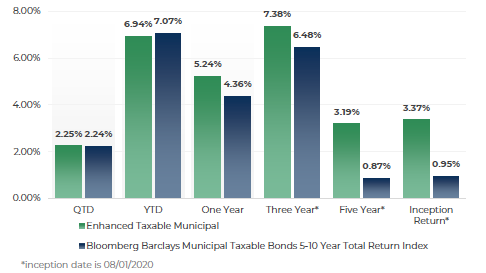
The One Oak Taxable Enhanced Municipal Portfolio, which is a laddered actively managed strategy, finished the quarter at +2.25% and the “Bloomberg Municipal Taxable Bonds 5-10Yr Total Return Unhedged” returned +2.24%.
The One Oak Tax Exempt Municipal Short Duration Solution composite inception date was September 2025. The strategy was flat for the month versus the “Bloomberg Municipal 1-3 Year Total Return Index Unhedged”.
Because of supply and geo-political issues, the municipal market lagged the fixed income rebound that took place in May and June (see chart below). With municipal credit in solid condition, attractive absolute yields, and positive seasonal conditions, the team at One Oak felt strongly these tailwinds would overcome the persistent negative pressures going into the third quarter.

Source: Bloomberg
The 10yr US Treasury yieldfell 27 basis points from4.42% to4.15% by end of Q3. The rally in treasuries was due to the federal reserve rate cutting cycle beginning again. On the municipal supply side, issuance during 3Q25 totaled $150 billion, up 6% year over year. The additional supply allowed One Oak to identify relative value in many primary and secondary market issues.
The taxable equivalent yield is approximately 5.50% for portfolios with a high investment grade rating and in the 40% tax bracket. Because of this, tax exempt securities hold more relative value than taxable securities for investors in this type of tax bracket.
Arguments can certainly be made as to why the broader markets could be overvalued and vulnerable to shocks. As unemployment continues to drift higher and inflation remains sticky, the overall health of the economy remains hazy at best. However, we are seeing resilience in the face of this, as tariffs and geopolitical unrest seem to be in place for the time being.
Municipal bonds still present compelling value after lagging broader markets in 2025. Even though spreads have tightened, they remain cheap to other fixed-income asset classes. Additionally, municipal mutual funds have experienced sustained inflows in each of the last seven easing cycles, dating back to 1992. Since the current easing cycle, now up to 4 cuts totaling 125bps, began in September of 2024, Lipper has recorded inflows in 10 of the 13-monthly periods, for a total of $50bn in inflows.
Favorable technical conditions and anticipated federal policy changes are expected to support continued interest in taxable municipal bonds, making them an appealing option for investors seeking yield and stability.
As the federal reserve eases, long only fixed income is poised to outperform. We are optimistic about municipal credit, and the firm will continue to seek out relative value while maintaining high credit quality.
The opportunity set is rich for the last quarter of the year, and we will continue to deploy our decades of experience to produce the best outcomes for our investors.
Additionally, please join us in welcoming Joseph Marren to the One Oak Capital Management team as Head of Research. He will oversee the firm’s research strategy across all sectors and asset classes. We are excited to have him on the team.
One Oak Capital Management is an SEC-registered investment adviser and manager of separately managed portfolios. Registration as an investment adviser does not imply a level of skill or training. This presentation is not an offer to sell, or the solicitation of an offer to purchase, any investment managed or sponsored by One Oak Capital Management or any of its affiliated entities (collectively, “One Oak”). The index shown is provided for illustrative purposes only, is unmanaged, reflects the reinvestment of income and dividends, and does not reflect the impact of advisory fees. Investors cannot invest directly in an index. Comparisons to indices have limitations because indices have volatility and other material characteristics that may differ from a particular OneOak strategy. One Oak's performance may differ substantially from the performance of an index. In addition, data used in the benchmark are obtained from sources considered to be reliable, but One Oak makes no representations or guarantees with regard to the accuracy of such data. The EnhancedMunicipal Portfolio uses active management and is not benchmarked to the index.
Past performance is not representative of future return performance. Net returns are calculated by deducting the highest standard fee from the gross returns on a quarterly basis. The returns reflect the net performance of employing One Oak's highest fee, 0.30% per year to the gross performance. Net returns do not include any additional intermediary fees that may be charged to the end investor. The presentation and the net performance is meant for financial professionals use only and is not intended for distribution to the end users. The returns include the reinvestment of dividends, interest, and other earnings. The information provided was calculated by One Oak Capital Management, LLC using a combination of proprietary and external data sources and has not been audited for accuracy. While interest on municipal bonds is generally exempt from federal income tax, it may be subject to the federal alternative minimum tax, or state or local taxes. Profits and losses on federally tax-exempt bonds may be subject to capital gains tax treatment. Fixed income risks include, but are not limited to, changes in interest rates, liquidity, credit quality, volatility, and duration. One Oak's management fees are deducted each quarter on the first month of the quarter: January, April, July and October. One Oak does not accrue its management fee for the remaining months and therefore the net performances for those months will be higher and does not represent the actual annual net returns.
Due to various risks and uncertainties, actual events, results or the actual performance of the investment may differ materially from those reflected or contemplated in the returns presented within. While assumptions underlying various statements as to the future performance are believed to be reasonable in nature, prospective investors should make their own assessments as to such assumptions and the associated risks, including the likelihood of the strategy achieving the corresponding results. All of which are subject to risks and uncertainties many of which are beyond the control of the investment adviser. As such, no assurance is given as to the realization of any such future performance. No representation or warranty is made as to the future performance or such forward-looking statements. The delivery of this presentation does not imply that any other information contained herein is correct as of any time subsequent to the presentation date. Actual performance results may differ from composite returns, depending on the size of the account, investment guidelines and /or restrictions, inception date, and other factors. One Oak Capital Management, LLC ("One Oak") claims compliance. with the Global Investment Performance Standards (GIPS) and has prepared and presented this report in compliance with the GIPS standards. One Oak has been independently verified for the periods 2019 through 2022.
Fees and yields are calculated by One Oak as of 07/22/25. Prospective investors are encouraged to consult a tax professional before making the decision to invest. Source: Schwab Data as of July 22, 2025. For illustrative purposes only. The framework discussed herein is hypothetical and does not represent the investment performance or the actual accounts of any investors or any funds. The results achieved in our simulations do not guarantee future investment results. It is possible that the actual results of an investor who invests in the manner these projections suggest will be better or worse than the projections, and that an investor may lose money by investing in the manner the projections suggest. The index is included for illustrative purposes only, is not available for direct investment and does not reflect the deduction of fees or expenses which would reduce returns.Actual performance results may differ from composite returns, depending on the size of the account, investment guidelines and /or restrictions, inception date, and other factorsTo invest with One Oak Capital Management LLC, you must be a qualified or accredited investor. Different share classes may have different results. Consult your individual statement.
These materials contained confidential and proprietary information and have been provided with the express understanding that their distribution or the divulgence of any of their contents to any person, other than the person(s) to whom they were originally delivered and such person’s advisors, without the prior consent of One Oak is prohibited.
To invest with One Oak Capital Management LLC, you must be a qualified or accredited investor. Different share classes may have different results. Consult your individual statement.
For more information regarding the Morningstar Rating methodology please visit www.morningstar.com/content/dam/marketing/shared/research/methodology/771945_Morningstar_Rating_for_Funds_Methodology.pdf
The PSN Municipal Universe consists of 213 strategies, across 98 firms. PSN utilizes a proprietary of our clients’ top priority performance screens. PSN Top Guns runs products in six proprietary categories in over 50 universes. This is a highly anticipated ranking and is widely used by institutional asset managers
References made to awards/rankings are not an endorsement by any third party to invest with One Oak and are not indicative of future performance. Investors should not rely on awards/rankings for any purpose and should conduct their own review prior to investing
One Oak Capital Management has done several tax-harvesting trades for the Enhanced and Enhanced Taxable Municipal Portfolio
Logos are protected trademarks of their respective owners and One Oak disclaims any association with them and any rights associated with such trademarks.

